Crypto Financial Modeling in Excel
- Understanding Cryptocurrency Basics
- Data Collection and Sources
- Building a Cryptocurrency Price Model
- Excel functions that are used in crypto financial modeling
- Forecasting Crypto Prices
- Portfolio Diversification and Risk Management
- Creating Financial Statements
- Scenario Analysis and Sensitivity Testing
- Cryptocurrency Valuation Models
- Visualizing Data and Results
- Backtesting and Model Validation
- Real-World Application and Case Studies
- Challenges and Limitations
- Conclusion
- FAQ
Cryptocurrencies are digital money, and they’re changing how we do finance. To understand them better and make wise money moves, we need to use special tools called financial models. This article is all about using Excel, a popular computer program, to create these models for cryptocurrencies. We highlight the importance of data accuracy, the challenges of modeling crypto assets, and the value of adapting traditional financial models for digital assets.
Understanding Cryptocurrency Basics
Cryptocurrency is digital money operating on a secure and decentralized blockchain system. It doesn’t rely on traditional banks to confirm transactions.
Cryptocurrency is decentralized digital money based on blockchain. Bitcoin and Ethereum are well-known, but there are over 9,000 different cryptocurrencies out there. Blockchain is like a worldwide ledger spread across many computers. Transactions are grouped into blocks and linked together in a chain.
“Cryptocurrency” gets its name from the encryption used to protect transactions. Complex coding keeps data safe during storage and transfer between wallets and the public ledger. Since Bitcoin’s start in 2009, cryptocurrencies and blockchain tech have kept advancing. They might soon enable trading various financial assets like stocks and bonds.
Why do you need to use Financial Modeling for Crypto?
Financial modeling is a versatile analytical tool used to scrutinize businesses or investments’ financial performance. It empowers individuals and entities to foresee future revenue streams, expenses, and cash flows, enabling well-informed decision-making.
In the context of the cryptocurrency space, the best crypto financial modeling in Excel assumes paramount significance, offering many benefits to investors, traders, and businesses alike.
How Financial Modeling Benefits Investors, Traders, and Businesses
Financial modeling serves as a powerful tool for investors, traders, and businesses, offering a structured approach to analyzing data, assessing opportunities, and making informed decisions.
In cryptocurrency markets, Excel-based financial modeling proves invaluable, providing stakeholders with the means to evaluate factors such as potential returns, risk, and valuation metrics. Let’s explore how financial modeling benefits each of these groups:
Investors
Excel for Financial Modeling in Cryptocurrency helps investors pinpoint attractive investment opportunities by evaluating factors like potential returns, risk, and valuation metrics.
For instance, investors can calculate a prospective cryptocurrency project’s internal rate of return (IRR) to determine its attractiveness. If the IRR exceeds their required rate of return, the investment may be deemed favorable.
Traders
Traders employ the best crypto financial modeling in Excel to craft strategies that capitalize on inefficiencies within the cryptocurrency market. By identifying undervalued assets, traders can purchase them and sell them at a profit when prices align with their target levels.
Businesses
Cryptocurrency businesses utilize financial modeling to gauge their financial performance accurately. By forecasting revenue, expenses, and cash flows, they can better understand their financial health.
For instance, a cryptocurrency exchange might leverage a financial model to predict its revenue and expenses for the upcoming year, thus informing budget allocation and resource management decisions.
Transform your financial analysis with our comprehensive Excel Financial Modeling Services, providing accurate and insightful models to drive informed decision-making.
Significance of Financial Modeling in the Crypto Space
- Managing Cryptocurrency Volatility: Excel for Financial Modeling in Cryptocurrency acts as a compass, allowing investors and traders to navigate these turbulent waters by identifying overvalued and undervalued cryptocurrencies. Models help in crafting strategies that mitigate risk and optimize returns.
- Navigating Complex Crypto Businesses: Cryptocurrency-based enterprises often possess intricate revenue models and cost structures. Financial modeling equips these businesses with a means to comprehend their financial performance comprehensively.
- Quantifying Cryptocurrency Risks: Cryptocurrencies represent a relatively novel asset class characterized by uncertainty surrounding their long-term value. Financial modeling serves as a compass, aiding investors and businesses in quantifying these risks. It allows stakeholders to make calculated decisions about their exposure to cryptocurrencies.
If you’re interested in enhancing your financial modeling skills, you might find our guide on “Scenario Analysis in Excel” quite valuable.
Data Collection and Sources
When gathering data in Excel for Financial Modeling in Cryptocurrency, it’s crucial to consider various reliable sources and APIs to ensure the accuracy and comprehensiveness of your data. Here’s an extension on where and how you can gather crypto data:
- Crypto Exchanges:
- Binance: Binance, one of the world’s largest crypto exchanges, offers a robust API that allows users to access real-time data on crypto prices, trading volume, order book depth, and more. This data is instrumental in creating accurate models.
- Coinbase: Coinbase is another prominent exchange that provides data via its API, including historical price data and trading information.
- Kraken: Kraken offers an API with access to trading data, order book data, and historical price data, enabling users to gather valuable information for modeling.
- Crypto Data Aggregators:
- CoinGecko: CoinGecko aggregates data from various exchanges, providing comprehensive data on crypto prices, market capitalization, trading volume, liquidity, and historical data. They also offer an API for developers to access their data programmatically.
- CoinMarketCap: CoinMarketCap is another well-known aggregator that offers a wide range of data, including historical price charts, market rankings, and exchange metrics. They also provide an API for data retrieval.
- Blockchain Analytics Platforms:
- Glassnode: Glassnode specializes in on-chain data analytics and offers insights into blockchain metrics such as transaction volume, wallet balances, network health, and more. Their data is invaluable for understanding the on-chain dynamics of cryptocurrencies.
- Nansen: Nansen focuses on Ethereum analytics and provides data on wallet behavior, token movements, DeFi activity, and more. It’s a go-to source for understanding the intricate activities of the Ethereum blockchain.
- Market Data Providers:
- CryptoCompare: CryptoCompare offers a comprehensive suite of cryptocurrency market data, including historical and real-time prices, order book data, and indices. They also provide APIs for easy access to their data.
- Messari: Messari provides data on a wide range of crypto assets, including detailed profiles, market metrics, and on-chain data. Their data is available through APIs, making it accessible for financial modeling.
- Public Blockchain Explorers:
- For specific blockchain data, public blockchain explorers like Etherscan for Ethereum or Blockchain for Bitcoin offer detailed insights into individual blockchain transactions, addresses, and smart contract interactions.
- Custom Scraping and Data Collection:
- In some cases, you may need to develop custom data collection solutions, such as web scraping or utilizing publicly available APIs provided by individual projects. This approach allows you to tailor data collection to your specific modeling needs.
Building a Cryptocurrency Price Model
To craft a crypto portfolio model within Microsoft Excel, adhere to these sequential steps:
Creating a crypto portfolio model in Excel involves several steps, including data input, calculation of asset values, and tracking performance. Here’s a step-by-step guide:
Step 1: Set Up Your Excel Spreadsheet
- Open Excel and create a new spreadsheet.
- Set up column headers: Date, Cryptocurrency, Ticker Symbol, Price, Quantity, Value.
- Enter crypto-related data in rows, including date, cryptocurrency, ticker symbol, price, and quantity.
- Use Excel’s formula = Price × Quantity to automatically calculate the value for each entry.
- Construct financial models within the spreadsheet, such as ROI calculations and future holdings forecasting.
- Organize the template with tabs like Portfolio, Trade Journal, and Dashboard for comprehensive tracking and analysis.
Step 2: Input Your Portfolio Data
- Starting from the second row, begin entering your data. For each cryptocurrency you own, input the transaction date, the cryptocurrency name, its ticker symbol, the quantity you own, the purchase price, and the calculated value. You can use Excel’s auto-fill feature to speed up data entry.
For example:

Step 3: Calculate Asset Values
- To calculate the value of each cryptocurrency holding, you can use the formula:
Value = Quantity × Price
Enter this formula in the Value column for each row where you have data.
Step 4: Calculate Return on Investment (ROI)
- To calculate ROI, you can use the formula:
ROI = ((Current Value – Purchase Value) / Purchase Value) × 100
In Excel, this formula can be entered in the ROI column for each cryptocurrency holding.
- Make sure the cell references in your formulas are correct so they update automatically as you add or change data.
Step 5: Create Additional Performance Metrics (Optional)
- You can create additional metrics to track performance, such as daily, weekly, or monthly returns. To calculate daily returns for a cryptocurrency (assuming daily data points), you can use the formula:
Daily Return = ((Today’s Price – Yesterday’s Price) / Yesterday’s Price) × 100
This formula helps you calculate the daily return for each cryptocurrency based on its historical price data.
Step 6: Create Charts and Visualizations (Optional)
To visualize your portfolio’s performance, you can create charts and graphs. Line charts are commonly used to show the growth of portfolio value over time. Here’s how to create a simple line chart:
- Select the date and corresponding value columns.
- Go to the “Insert” tab in Excel.
- Choose the line chart type that suits your data.
Step 7: Analyze and Refine Your Model
- Continuously update your portfolio data in the spreadsheet. As you make additional investments or track changes in cryptocurrency prices, update the relevant rows in your spreadsheet.
- Periodically recalculate ROI, review your portfolio performance, and make informed investment decisions based on the insights provided by your model.
By following these steps, you can create a basic crypto portfolio model in Excel that allows you to track your investments, assess their performance, and make data-driven decisions. Advanced users may further customize their models with additional metrics, data sources, or automation features.
For more insights on extrapolation techniques using Excel, don’t forget to check out our article on “How to Extrapolate in Excel.”
Excel functions that are used in crypto financial modeling
Here are some Excel functions that are commonly used in crypto financial modeling:
SUMIF
With the SUMIF function, you can add up values within a range that meets specific criteria. For instance, calculate the total value of cryptocurrencies in your portfolio trading above a certain price.
COUNTIFS
The COUNTIFS function helps you count the number of cells in a range that satisfies particular conditions. For example, count how many cryptocurrencies in your portfolio have seen a price increase over the past day.
AVERAGEIFS
Utilize the AVERAGEIFS function to determine the average of values in a range that meets specific criteria. For instance, calculate the average return of cryptocurrencies in your portfolio that rank within the top 10% by market capitalization.
VLOOKUP
VLOOKUP allows you to search for a value in a table and retrieve the corresponding value from another column. For instance, find the price of a cryptocurrency in a table of cryptocurrency prices and retrieve the associated cryptocurrency symbol.
INDEX
The INDEX function retrieves a value from a range based on specified row and column numbers. For instance, obtain the price of the first cryptocurrency in a table of cryptocurrency prices using the INDEX function.
MATCH
Employ the MATCH function to identify the position of a value within a range. For instance, determine the position of a cryptocurrency symbol in a table of cryptocurrency symbols using MATCH.
DATE
The DATE function assists in creating a date value using a given year, month, and day. For example, generate a date value representing the first day of the current month with DATE.
EDATE
Use the EDATE function to add or subtract a specified number of months from a date value. For example, calculate the date of the next monthly candle for a cryptocurrency using EDATE.
To gain a comprehensive understanding of sensitivity analysis in Excel, take a look at our ultimate guide complete with practical examples: “Sensitivity Analysis in Excel: The Ultimate Guide with Examples.”
Boost your productivity by getting a free consultation from Excel experts, and discover tailored solutions to optimize your data management and analysis.
Forecasting Crypto Prices
Fundamental analysis and technical analysis are two different approaches to analyzing securities.
Understanding Fundamental Analysis
Fundamental analysis plays a pivotal role in finance, offering investors and traders a comprehensive approach to assessing the value of assets. It operates on the premise that the intrinsic worth of an asset can be discerned by evaluating various economic and financial factors.
While fundamental analysis is commonly associated with the stock market, its principles can be applied to diverse asset classes, including cryptocurrencies, commodities, and real estate.
In the context of the stock market, fundamental analysts embark on a deep dive into a company’s financial health and overall economic conditions that might influence its performance.
Key aspects examined include the company’s balance sheets, income statements, cash flow statements, and annual reports. This meticulous scrutiny allows analysts to ascertain the company’s intrinsic value.
Fundamental analysis serves as an invaluable tool for long-term investors seeking to make informed decisions about their portfolios.
By evaluating both tangible and intangible aspects of a company or investment, fundamental analysis aims to answer the critical question of whether an asset is undervalued or overvalued.
A Detailed Look at Technical Analysis
In contrast, technical analysis is a trading methodology that assesses statistical data and historical price trends.
Technical analysis is particularly popular among short- to medium-term traders who rely on charts, patterns, and mathematical indicators to make trading decisions.
While fundamental analysts delve into a company’s financials and business operations, technical analysts primarily focus on an asset’s price history and trading volume.
They contend that the past behavior of an asset can serve as a reliable predictor of its future movements. To uncover potential trends and patterns, technical analysts employ various tools, such as moving averages, oscillators, and chart patterns.
Technical analysis is more concerned with identifying optimal entry and exit points for trades rather than evaluating the underlying business fundamentals.
It thrives on mathematical equations and visual representations, helping traders make sense of market sentiment and price dynamics.
Exploring Technical Indicators
Technical indicators serve as the backbone of technical analysis, offering traders a systematic way to assess an asset’s past performance and forecast future movements. The four main categories of technical indicators include:
- Trend Indicators: These indicators reveal market direction, fluctuating between high and low values, forming chart patterns. Examples include MACD, Parabolic SAR, and components of Ichimoku Kinko Hyo.
- Momentum Indicators: Gauge trend strength and signal potential reversals. Common indicators include ADX, RSI, and Stochastic Oscillator.
- Volume Indicators: Assess buying or selling intensity. Examples include OBV, volume indicator, Klinger Volume Indicator, and Chaikin Money Flow.
- Volatility Indicators: Measure price change speed. Bollinger Band is an example.
Selecting the Best Technical Indicators
Selecting suitable technical indicators depends on your trading strategy and asset type, like cryptocurrencies or stocks. Each indicator serves a distinct purpose, providing insights into market conditions.
For crypto assets and stocks alike, here are some widely used technical indicators:
On-Balance Volume (OBV)
This indicator utilizes an asset’s trading volume to make price predictions. It assesses the relationship between trading volume and price changes.

Source: Cointelegraph.com
Accumulation/Distribution Line
This indicator gauges the flow of capital in and out of a market, helping traders identify buying or selling pressure.
Average Directional Index (ADX)
ADX measures an asset’s supply and demand dynamics, providing insights into the strength of prevailing price trends.
Aroon Indicator
In making the best crypto financial modeling in Excel, this tool is used to identify the strength of a trend and potential shifts in an asset’s price movement.
Moving averages
Moving averages are a technical analysis tool that can identify trends and predict future prices. Moving averages are calculated by averaging the closing prices of a cryptocurrency over a specified period.
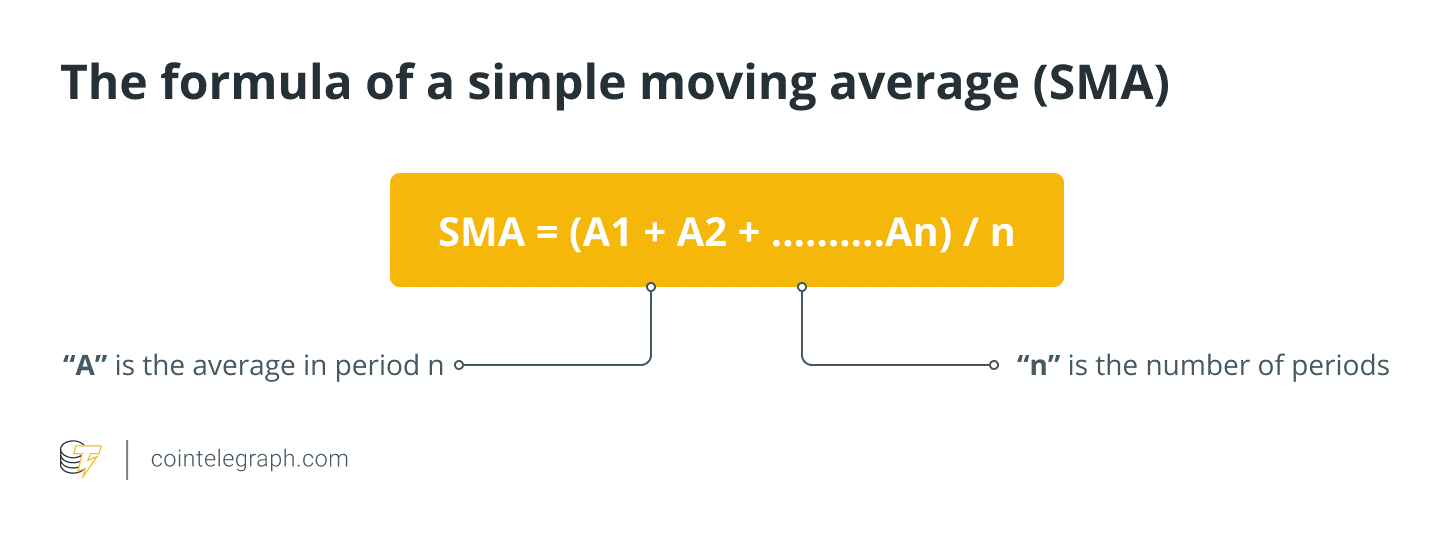
Source: Cointelegraph
For example, a 50-day moving average is calculated by averaging the closing prices of a cryptocurrency over the past 50 days.
Moving averages can be used to generate buy and sell signals. For example, if the price of a cryptocurrency crosses above its 50-day moving average, it could be a signal to buy. If the price of a cryptocurrency crosses below its 50-day moving average, it could be a signal to sell.
Moving Average Convergence Divergence (MACD)
MACD is a versatile indicator used to assess the strength of an asset’s price trend and identify potential trend reversals.

Source: Cointelegraph
Exponential Moving Average (EMA)
EMA is a variation of the moving average indicator that offers buy and sell signals based on the average price changes over time.
Relative Strength Index (RSI)
RSI, a momentum indicator, helps traders determine whether an asset is overbought or oversold by evaluating recent price changes.
Stochastic Oscillator
Similar to RSI, the Stochastic Oscillator identifies overbought and oversold conditions in the market, helping traders time their entries and exits.
Streamline your tasks and increase efficiency with our Excel Automation Services, designed to automate repetitive processes and enhance your workflow.
Portfolio Diversification and Risk Management
Here are some tips for risk assessment:
Evaluating Risk in Cryptocurrency Investments
In crypto, risk assessment means recognizing and evaluating potential risks like:
- Volatility: Crypto’s wild price swings make future predictions challenging, risking significant losses.
- Liquidity: Some cryptos are illiquid, making it hard to buy or sell, especially during price drops.
- Security: Digital wallets can be vulnerable to hacks, leading to total fund loss.
- Regulatory Risk: Evolving regulations can impact crypto values unpredictably.
Risk Reduction in Cryptocurrency Investments
Investors can employ various strategies to manage risk in their cryptocurrency investments, including:
- Invest What You Can Afford to Lose: Given the high-risk nature of cryptocurrencies, it’s crucial to invest only what you can afford to lose. Never allocate funds earmarked for essential expenses or those you cannot afford to lose in case of a value decline.
- Diversify Your Portfolio: Diversification is a fundamental risk management approach. By investing in a range of cryptocurrencies, overall risk can be reduced. This strategy hinges on the principle that if one cryptocurrency’s price falls, others in the portfolio may not experience a commensurate decline.
- Implement Stop-Loss Orders: Stop-loss orders serve as a means to limit potential losses. These orders trigger the sale of a cryptocurrency if its price drops below a predefined threshold, preventing excessive losses during sudden price declines.
- Ensure Cryptocurrency Security: Safeguarding your cryptocurrencies is paramount. Employ strong passwords for your digital wallets and store your assets in secure locations.
Creating Financial Statements
To create financial statements for crypto businesses in the best crypto financial modeling in Excel, you will need to gather the following information:
- Crypto Asset Holdings: This section should encompass a detailed breakdown of the business’s cryptocurrency holdings. It includes information about the types of cryptocurrencies held, the quantity of each cryptocurrency, and their respective market values.
Crypto asset holdings represent a significant portion of the company’s assets, and their valuation can be highly volatile.
- Crypto Asset Transactions: Keeping a thorough record of all cryptocurrency transactions is crucial for accurate financial reporting. This involves documenting every transaction involving cryptocurrencies, including purchases, sales, exchanges, and transfers.
It’s vital to maintain transaction details such as dates, amounts, counterparties, and transaction fees. These records provide insight into the company’s trading activities and tax implications.
- Other Financial Information: Beyond crypto assets, businesses should also track traditional financial data. This includes income, expenses, and liabilities unrelated to cryptocurrencies.
This broader financial context is essential for understanding the overall financial health of the business.
With the gathered information, you can proceed to create the following financial statements:
- Balance Sheet: The balance sheet, also known as the statement of financial position, offers a snapshot of the business’s financial condition at a specific moment in time.
It lists the company’s assets (including crypto holdings), liabilities, and shareholders’ equity. The balance sheet adheres to the fundamental accounting equation: Assets = Liabilities + Equity. This statement provides an overview of the company’s financial stability and liquidity.
- Income Statement: The income statement, often referred to as the profit and loss statement (P&L), presents the company’s financial performance over a defined period.
It records revenue expenses (including any crypto-related fees), and calculates the net income or loss. The income statement helps stakeholders understand the company’s profitability and operating efficiency.
- Cash Flow Statement: The cash flow statement tracks the cash flow in and out of the business during a specific timeframe.
It categorizes cash flows into three main sections: operating activities, investing activities, and financing activities. For a crypto-focused business, it’s essential to distinguish between cash flows related to cryptocurrency transactions and those from traditional financial activities.
The cash flow statement provides insights into the company’s liquidity and its ability to meet its financial obligations.
For a comprehensive exploration of regression analysis in Excel, explore our ultimate guide with real-world examples: “Regression Analysis in Excel: The Ultimate Guide with Examples.”
Scenario Analysis and Sensitivity Testing
Scenario analysis and sensitivity testing are invaluable tools for understanding and managing the impact of various factors on your crypto portfolio in the best crypto financial modeling in Excel. Here’s an extended explanation of their significance:
Scenario Analysis
Scenario analysis is a forward-looking technique that helps you assess how different hypothetical situations or scenarios may affect your crypto portfolio. Given the high volatility and unpredictability of digital assets, it’s essential in the crypto space. Here’s how it adds value:
- Risk Identification
By creating various scenarios, you can identify potential risks that your portfolio may face in the future. These scenarios can encompass multiple possibilities, such as market crashes, regulatory changes, technological developments, or macroeconomic events.
- Opportunity Recognition
Scenario analysis also allows you to recognize potential opportunities. For example, you can create scenarios to assess how your portfolio might perform during a bull market, a crypto adoption wave, or a period of increased institutional investment.
- Risk Mitigation Strategies
Once risks and opportunities are identified, you can develop strategies to mitigate the identified risks and capitalize on opportunities. For instance, if a scenario reveals vulnerability to a bear market, you might diversify your holdings into more stable assets or set stop-loss orders to limit potential losses.
Sensitivity Testing
Sensitivity testing focuses on examining how changes in specific input variables impact your portfolio’s performance. Here’s why it’s crucial:
- Variable Identification
Sensitivity testing helps identify which variables have the most significant impact on your portfolio’s value. For crypto investors, these variables often include cryptocurrency prices, trading volumes, or external factors like regulatory changes.
- Quantifying Sensitivity
It allows you to quantify your portfolio’s sensitivity to changes in those key variables. For instance, you can determine how much your portfolio value would change if the price of Bitcoin, a significant holding, increases or decreases by a certain percentage.
- Informed Decision-Making
Armed with sensitivity analysis, you can make more informed investment decisions. For example, if your portfolio is highly sensitive to Bitcoin’s price movements, consider adjusting your asset allocation to reduce this sensitivity.
Using Excel Tools for Sensitivity Analysis
Excel for financial modeling in cryptocurrency provides several tools to perform sensitivity analysis effectively. Two commonly used ones are Data Tables and Goal Seek.
1. Data Tables: Data Tables help you analyze how one or more input variables affect a dependent variable. For example, you can use a Data Table to assess the impact of different Bitcoin prices on your portfolio’s total value.
2. Goal Seek: Goal Seek allows you to find the value of an input variable required to achieve a specific goal. For instance, you can use Goal Seek to determine the price of Bitcoin needed to accomplish a particular portfolio return.
Cryptocurrency Valuation Models
Cryptocurrencies represent a novel and distinctive asset class that challenges the applicability of traditional valuation models.
While these digital assets don’t conform precisely to conventional valuation methodologies, several specialized models have been developed to assess their worth. Here’s an extended discussion on this topic:
Discounted Cash Flow (DCF) Model
The DCF model, a fundamental tool in financial valuation, calculates an asset’s present value by discounting its future cash flows. Adapting this model for cryptocurrencies requires estimating their future cash flows, which can be intricate due to the uncertainties surrounding these relatively new assets.
Network Value to Transactions (NVT) Ratio
The Network Value to Transactions (NVT) ratio is a distinctive cryptocurrency valuation metric.
It evaluates the relationship between the cryptocurrency’s market capitalization and its daily transaction volume. Essentially, NVT assesses how efficiently a cryptocurrency’s market cap is justified by the volume of transactions taking place on its network.
A high NVT ratio may suggest that the network is overvalued relative to its transaction activity, while a low NVT ratio could indicate potential undervaluation. This metric is particularly useful for assessing the adoption and utility of a cryptocurrency.
Metcalfe’s Law
Metcalfe’s Law is a mathematical concept that pertains to the value of a network being proportionate to the square of the number of its users.
When applied to cryptocurrencies, it implies that the value of a cryptocurrency network grows exponentially with an increase in the number of network participants, such as users, nodes, or addresses.
Analysts often use Metcalfe’s Law to estimate a cryptocurrency’s potential future value by forecasting the growth in its user base. However, it’s important to note that the actual correlation between network size and cryptocurrency value may vary based on factors like technology, adoption, and utility.
Stock-to-Flow Ratio
The Stock-to-Flow (S2F) ratio is a model primarily associated with assets like precious metals and commodities, but it has been adapted for use in valuing cryptocurrencies, notably Bitcoin.
This ratio assesses the scarcity of an asset by comparing its existing supply (stock) to its annual production rate (flow). For Bitcoin, the stock represents the total number of coins in circulation, while the flow signifies the annual rate of new Bitcoin issuance through mining.
A high S2F ratio suggests that an asset is relatively scarce, which can contribute to its perceived value. Bitcoin proponents often use this model to support the digital currency’s potential as a store of value.
Visualizing Data and Results
Creating meaningful visualizations, charts, and reports in Excel is essential for effective financial modeling, as it allows you to communicate your findings clearly and concisely. Here’s a guide on how to do this:
Step 1: Organize Your Data
Before you create visualizations, ensure your data is well-organized in Excel. Use separate tabs or sections for raw data, calculations, and visualizations. Clear organization makes it easier to update and maintain your models.
Step 2: Choose the Right Visualization
Choose the most suitable visualization type for your data and insights, whether it’s a line chart for tracking trends over time, a bar chart for comparing categories, a pie chart for depicting parts of a whole, a scatter plot for visualizing relationships between variables, or a heatmap for revealing patterns in extensive datasets.
Step 3: Create Visualizations
Here’s how to create a basic line chart to visualize the performance of a cryptocurrency portfolio:
- Select the data you want to chart, including the dates and portfolio values.

- Go to the “Insert” tab, click on “Chart” or “Recommended Charts,” and choose the “Line” chart type.

- Excel will generate a default chart. You can customize it by adding titles, labels, and legends. Right-click on chart elements to format them according to your preferences.

- Use the chart’s data source options to ensure it references your data accurately. This is crucial when updating your model with new data.
- Consider adding additional visual elements like trendlines, markers, or data labels to enhance clarity.
Step 4: Interpret and Explain
Enhance visualizations with clear explanations. Include descriptive titles, axis labels, legends for multiple elements, and trendlines where applicable to aid viewers’ understanding of the content.
Step 5: Create Reports
In order to give structure and context to your financial modeling efforts, it’s essential to generate comprehensive reports that encapsulate crucial insights.
These reports commonly encompass an executive summary, offering a concise introduction to your model and its objectives, a methodology section that elucidates your modeling approach and underlying assumptions, detailed findings and analyses derived from your model’s output, recommendations based on those findings, and a range of visualizations, such as charts, graphs, and tables, to bolster your analysis.
Step 6: Use Excel Features for Clarity
Excel provides several valuable features to enhance clarity in your visualizations and reports. You can employ conditional formatting to apply color scales, data bars, or icons that spotlight crucial data points.
Data validation allows you to utilize dropdown lists or input restrictions, ensuring data accuracy. You can effortlessly filter and sort information by converting your data into Excel tables.
Additionally, you can improve comprehension by adding cell comments that provide extra context or explanations where needed. These features collectively contribute to creating more effective and informative reports in Excel.
Step 7: Review and Iterate
Thoroughly review your visualizations and reports for accuracy and clarity. Ensure that someone unfamiliar with your model can understand your findings. Be open to feedback and iterate on your model and communication as needed.
Clear communication in financial modeling is paramount. Your visualizations and reports should tell a story, making complex data and analysis accessible to a broader audience. Effective communication ensures your insights are understood and actionable, whether you’re presenting to stakeholders, colleagues, or yourself.
Backtesting and Model Validation
Backtesting involves evaluating the performance of a model using historical data to see how well it would have predicted past market movements. It helps determine if the model’s predictions align with actual market outcomes and assesses its reliability.
Model validation goes a step further by assessing a model’s robustness, accuracy, and generalizability. It involves using out-of-sample data, which the model hasn’t seen before, to test its predictive power. The goal is to ensure that the model doesn’t just work well with historical data (overfitting) but also performs effectively in new, unseen market conditions.
Both backtesting and model validation are essential for risk management and decision-making in crypto investments. They help traders and investors gain confidence in their models and strategies, reducing the potential for costly errors in the dynamic and volatile crypto market.
Backtesting and model validation can be used in a variety of ways, including:
- Problem Identification: Backtesting is an effective tool for spotting potential issues within the model. It can unveil unrealistic assumptions or coding errors that might have otherwise gone unnoticed.
- Model Improvement: Backtesting can be a catalyst for model enhancement. By analyzing the outcomes, you can pinpoint areas where the model requires recalibration or the inclusion of additional variables to enhance its accuracy.
- Performance Assessment: Backtesting enables a comprehensive evaluation of the model’s performance across various market conditions. This evaluation offers valuable insights into the risks and rewards associated with employing the model in real-world scenarios.
- Validation: Model validation is a critical step in ensuring the model’s accuracy and reliability. It acts as a safeguard to verify that the model’s predictions align with actual market outcomes, establishing trust in the model before implementing it for investment decisions.
Real-World Application and Case Studies
Here are real-world instances of crypto financial modeling in Excel and their decision-making roles:
Success Story – Paradigm
Paradigm, a crypto investment firm, deploys diverse financial models to spot undervalued cryptocurrencies. Among these models is the Discounted Cash Flow (DCF) model, which assesses cryptocurrencies by discounting their future cash flows to present value.
Paradigm harnessed the DCF model to evaluate Bitcoin in 2018. The model revealed Bitcoin’s undervaluation at the time. Consequently, Paradigm made a substantial investment in Bitcoin, which has since surged in value by over 1000%, resulting in a highly successful outcome.
Cautionary Tale – Three Arrows Capital
Three Arrows Capital, a crypto hedge fund, employed a range of financial models, including a leverage model, to enhance investment returns through borrowed capital.
Three Arrows Capital utilized the leverage model to invest in TerraUSD (UST), a stablecoin pegged to the US dollar. However, in May 2022, UST lost its peg to the US dollar, leading to a sharp devaluation.
Consequently, Three Arrows Capital was unable to meet its loan obligations, ultimately leading to the hedge fund’s declaration of bankruptcy.
These instances exemplify how crypto financial models can inform decision-making processes. However, it is vital to recognize that all financial models hinge on underlying assumptions, and their accuracy is contingent upon the validity of these assumptions.
Furthermore, it’s essential to acknowledge that despite their support, financial models do not guarantee investment success in the dynamic and unpredictable realm of cryptocurrencies.
Challenges and Limitations
Crypto financial modeling in Excel is indeed a formidable undertaking, accompanied by several challenges and limitations that necessitate careful consideration when constructing and employing these models. Here’s an extension of these challenges and some strategies to address them:
Data Accuracy
Data accuracy is of most important concern in crypto financial modeling in Excel. The relatively new and unregulated nature of crypto markets results in a scarcity of high-quality historical data. These markets’ inherent volatility also poses challenges in accurately predicting future price movements.
Market Volatility
The unpredictable and inconsistent nature of crypto markets contributes significantly to the complexity of financial modeling. Extreme price fluctuations can disrupt the reliability of models designed to forecast values over time.
Regulatory Factors
The ever-evolving regulatory landscape surrounding cryptocurrencies introduces a layer of uncertainty that impacts the development of financial models. Governments worldwide are continually adapting their regulations, making it challenging to create models that accurately reflect future market dynamics.
Complexity of Crypto Assets
Crypto assets are varied financial instruments, making it difficult to create models that compress their complexity sufficiently.
Limited Track Record
Crypto markets have a relatively brief history, making creating financial models based on extensive historical data challenging.
Conclusion
This comprehensive guide explores cryptocurrency financial modeling, covering basics, practical steps, and real-world examples. Beginning with cryptocurrency fundamentals and the role of financial modeling, it delves into setting up Excel spreadsheets, data collection, and portfolio modeling.
Forecasting crypto prices, risk assessment, and visualization creation are also detailed. Real-world examples illustrate model impact while acknowledging challenges and limitations and preparing readers for their crypto investment journeys.
Engaging in your cryptocurrency financial modeling in Excel journey can be a rewarding and empowering experience. It equips you with the tools to make well-informed investment decisions in this rapidly evolving and exciting space. By understanding the fundamental principles and techniques outlined in this guide, you gain a deeper insight into the dynamics of cryptocurrency markets.
FAQ
For accurate cryptocurrency data in Excel financial modeling:
- Crypto Exchanges: Use Binance, Coinbase, and Kraken APIs for real-time data.
- Data Aggregators: Consider CoinGecko, CoinMarketCap, and their APIs.
- Blockchain Analytics: Glassnode, Nansen for on-chain insights.
- Market Data: CryptoCompare, Messari, and their APIs.
- Blockchain Explorers: Etherscan, Blockchain for blockchain-specific data.
- Master Excel functions for crypto:
- SUMIF adds based on criteria.
- COUNTIFS counts with conditions.
- AVERAGEIFS finds averages selectively.
- VLOOKUP retrieves data from tables.
- INDEX gets values by row and column.
- MATCH finds value positions.
- DATE creates dates from details.
- EDATE adjusts dates with months.
To manage cryptocurrency price volatility in your models:
- Quality Data: Use accurate and comprehensive data, ensuring it’s free from anomalies
- Multiple Sources: Utilize multiple data sources for a more robust perspective.
- Varied Models: Explore diverse modeling techniques for accuracy.
- Stress Tests: Assess your model’s performance under extreme conditions.
- Tool Usage: Treat the model as an aid, not a decision-maker.
Our experts will be glad to help you, If this article didn’t answer your questions. ASK NOW
We believe this content can enhance our services. Yet, it’s awaiting comprehensive review. Your suggestions for improvement are invaluable. Kindly report any issue or suggestion using the “Report an issue” button below. We value your input.


