Mastering Extrapolation in Excel: A Complete Guide
Excel is widely used for data analysis, modeling, and making informed business decisions.
One of the valuable features Excel offers is the ability to extrapolate, enabling users to make predictions and estimate values beyond the range of known data. Still, users must be familiar with how to extrapolate in Excel before using their data.
In this article, we will provide a comprehensive guide on how to extrapolate in Excel, exploring various techniques, functions, and best practices to unleash the full potential of this versatile tool.
What is Extrapolation? (with an Example)
Extrapolation in Excel involves using known values to calculate unknown values, enabling users to make predictions, analyze data, and visualize outcomes. It can be used to forecast linear or exponential changes over time.
When we learn more about how to extrapolate in Excel, we see that a lot of things can be done with Extrapolation.
For instance, organizations can employ Extrapolation to project the growth of their customer base or fluctuations in expenses.
Extrapolation can be likened to an informed speculation or a hypothesis. It involves utilizing existing facts and observations of a current or familiar situation to predict future outcomes.
One standard method of Extrapolation in Excel is using linear regression analysis.
The LINEST function is often used to calculate the best-fit line through a set of data points, and the forecast function can be utilized to predict future values based on that line. By specifying a new x-value outside the range of the known data, you can use the forecast function to extrapolate a corresponding y-value.
For example, let’s say you have a series of x-values in column A and corresponding y-values in column B. You can use the forecast function to extrapolate a new y-value for a given x-value beyond the known data range. Here’s an example formula:
=FORECAST(x-value, known_y’s, known_x’s)
Replace “x-value” with the value for which you want to extrapolate a y-value, “known_y’s” with the range of y-values in the known data, and “known_x’s” with the range of x-values in the available data.
Keep in mind that Extrapolation in Excel relies on the assumption that the underlying trend or relationship observed in the known data will continue in the future.
Extrapolation vs. Interpolation in Excel
Interpolation and Extrapolation are two distinct methods used in data analysis and prediction.
Interpolation refers to estimating a value within the range of known data points. In this scenario, we use our mathematical function or regression line to predict the dependent variable’s value for an independent variable within the existing data range.
Extrapolation, on the other hand, involves predicting the value of the dependent variable for an independent variable that lies outside the range of known data. It entails extending our function or regression line beyond the existing data points.
Suppose you have a dataset that records the population of a city over several years:
Year | Population (in millions)
——————————-
2010 | 2
2012 | 2.5
2014 | 3.2
2016 | 3.8
You want to interpolate the population for the year 2013. Since 2013 falls within the range of known data, this is an example of interpolation.
By observing the trend, you can estimate the population value for 2013. Let’s assume the interpolation gives a population of 2.8 million for 2013.
Continuing from the previous example, let’s say you want to extrapolate the population for 2020, which is outside the range of known data. This is an example of Extrapolation. By extending the observed trend, you can predict the population value for 2020.
Extrapolation involves more significant uncertainty, assuming the observed trend will continue beyond the known data points.
What is Extrapolation Used for?
Extrapolation in Excel is commonly used for predicting or estimating values beyond the range of known data. It allows users to extend trends and make forecasts outside the existing data points. Here are a few different methods of how people extrapolate in Excel:
1. Future Projections
Excel can be used to extrapolate future trends based on historical data. By fitting a regression line or curve to the known data, users can extend the trend to predict values for future periods. This helps forecast sales, population growth, financial projections, and more.
2. Budgeting and Financial Planning
Extrapolation in Excel can be used to forecast financial variables such as revenue, expenses, or cash flows. Organizations can estimate future financial performance by extrapolating historical data and planning budgets accordingly.
3. Demand Forecasting
Businesses can utilize Excel Extrapolation to predict future product or service demand. They can extend the trend by analyzing past sales data to estimate future demand levels, aiding inventory planning, production scheduling, and resource allocation.
4. Performance Analysis
If you properly learn how to extrapolate in Excel, you will see that extrapolation can be used in Excel to assess the performance of various parameters over time. By extrapolating historical trends, users can make comparisons, identify patterns, and make informed decisions based on projected values.
5. Market Research
Excel’s Extrapolation can be valuable in market research to predict consumer behavior, demand patterns, or market trends. Researchers can gain insights into future market dynamics by extrapolating survey or historical market data.
What is the Extrapolation Formula in Excel?
One of the main things that we have to talk about is how to extrapolate in Excel, is Extrapolation Formula.
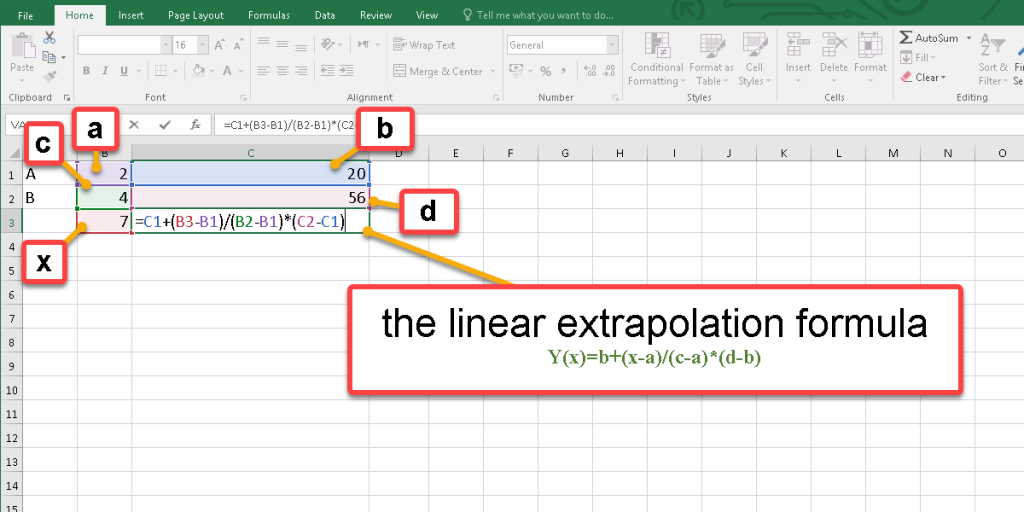
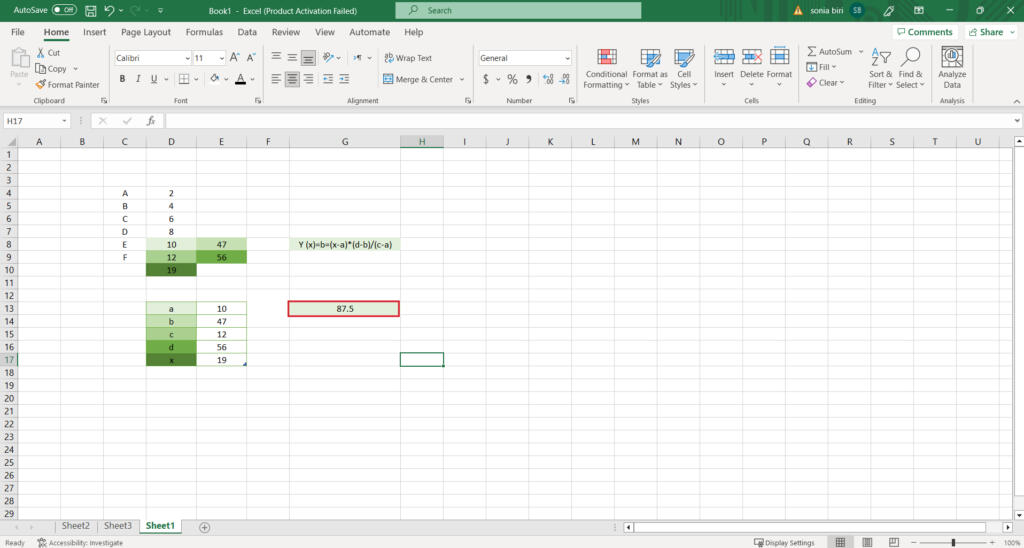
To extrapolate data by formula, we need to use two points of the linear chart that we plotted before.
- A(a, b)
- B(c, d)
The linear extrapolation formula is:
Y(x)=b+(x-a)*(d-b)/(c-a)
You can enter the formula according to two points of your data values and extrapolate the target value.
How to Use the Formula for Data Extrapolation in Excel
To understand more about extrapolation and how to extrapolate in Excel, we will provide an example of how to use formulas for data extrapolation in Excel.
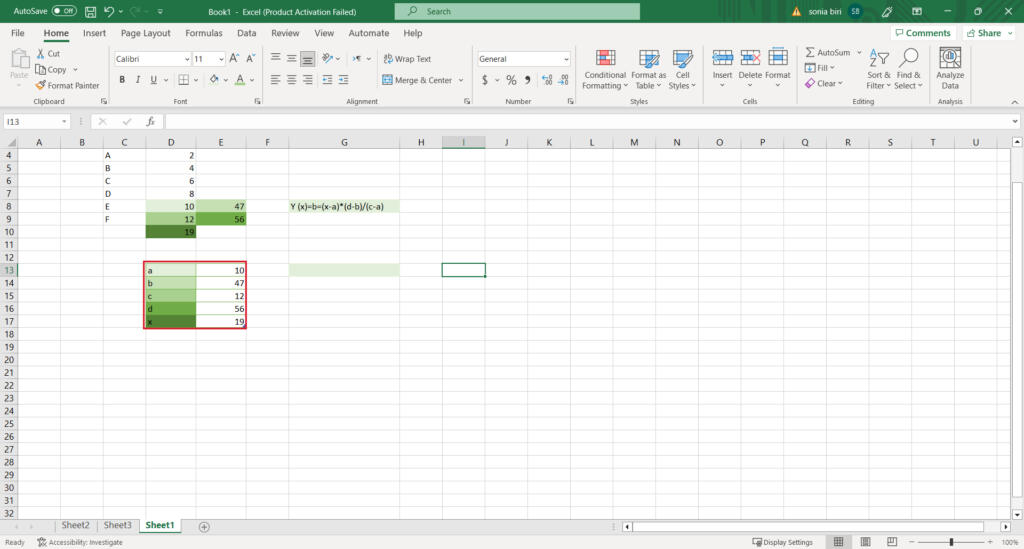
1. Organize your Data
To extrapolate data using a formula, we require two data points from the linear chart that was previously plotted.
- A(a, b)
- B(c, d)
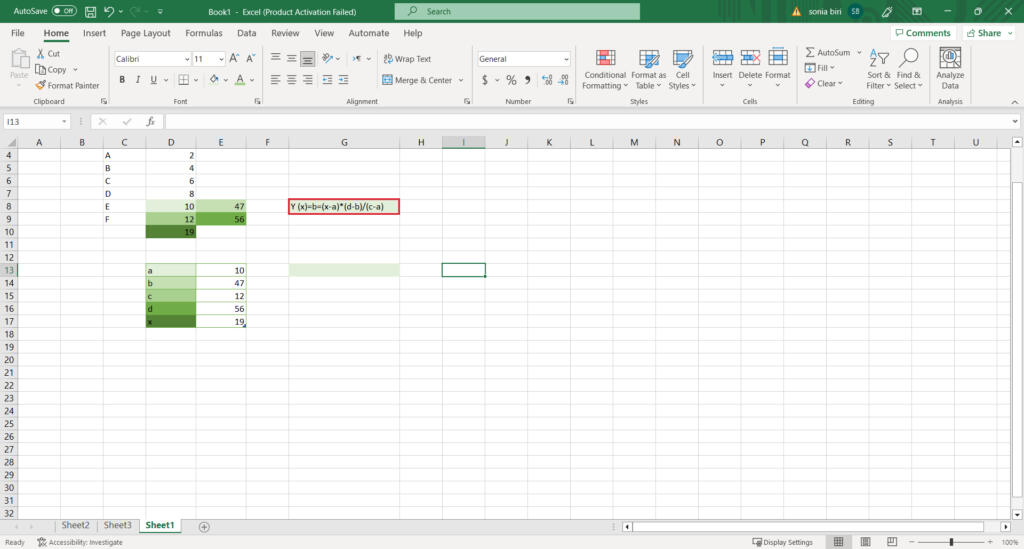
2.Determine the Formula
You need to determine the appropriate formula for Extrapolation depending on the nature of your data.
In this example, the linear extrapolation formula is:
Y(x)=b+(x-a)*(d-b)/(c-a)
3.Calculate the Coefficients
Using regression analysis or other methods, calculate the coefficients required for your chosen formula.
4.Enter the Formula
Once you have the coefficients, you can enter the formula in a new cell to extrapolate data.
5.Extend the Formula
Copy the formula down the column or across the row to extrapolate the dependent variable values.
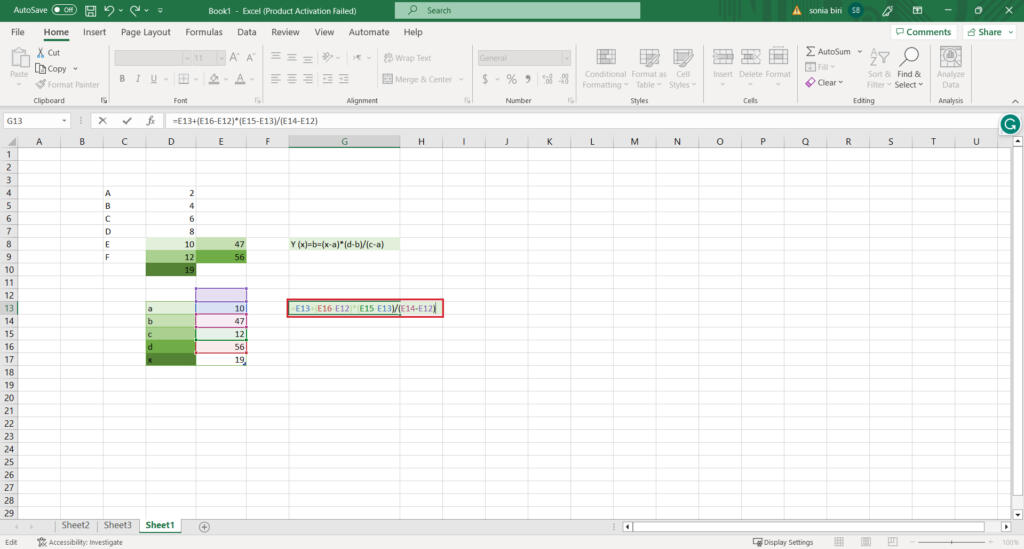
6.Calculate your Data
Best Extrapolation Methods in Excel
Continuing with the analysis, we will now discuss the best extrapolation methods in Excel.
1. Using Formulas
Excel provides various mathematical functions that can be used for Extrapolation. For example, you can use the TREND function to calculate future values based on existing data points and extend the trend. This function uses linear regression to estimate values and is helpful when there is a clear trend in the data.
2. Applying Trendline
Trendlines visually represent the trend in your data, and you can extend the trendline to project future values. Right-click on a data series in a chart, select “Add Trendline,” choose the desired type of trendline (e.g., linear, exponential, polynomial), and check the “Extend trendline” option.
3. By the FORECAST Function
Excel’s FORECAST function is specifically designed for Extrapolation. It uses linear regression to predict future values based on existing data.
In this example, our data until 2022 is available and accurate, but anything beyond that is outside the range of known data.
4. By Extrapolating Sheets
Excel also offers the ability to extrapolate data using the “Fill” handle combined with a pattern or formula. You can enter a pattern in a few cells to establish a trend and then use the Fill handle to extend the pattern, automatically extrapolating the values across a range of cells.
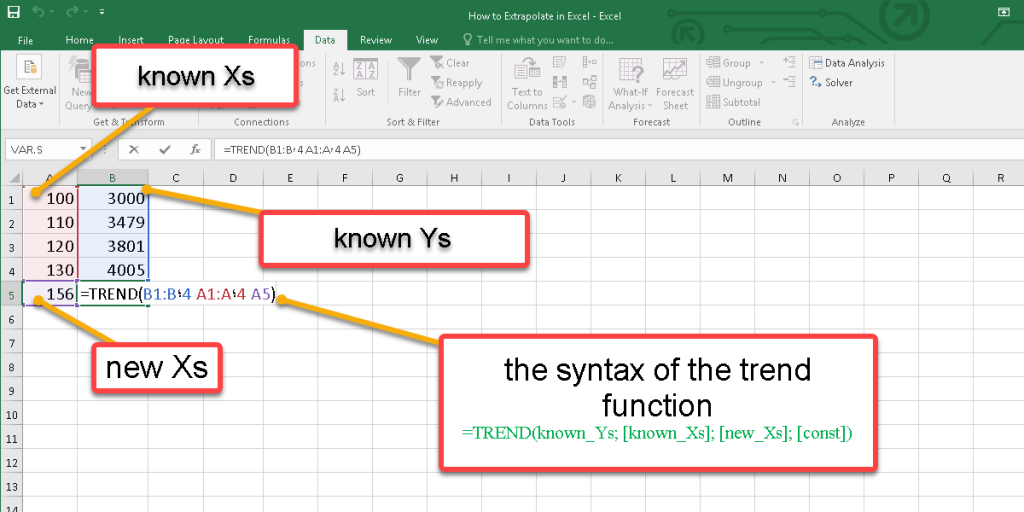
5. By Using the Excel TREND Function
The TREND function in Excel can be used to extrapolate values based on existing data. It calculates the y-values corresponding to a given set of new x-values using linear regression.
The syntax is as follows :
=TREND(known_y’s, known_x’s, new_x’s)
“known_y’s” are the existing y-values, “known_x’s” are the corresponding x-values, and “new_x’s” are the x-values for which you want to extrapolate the y-values.
These methods provide different ways to extrapolate in Excel, each with its own advantages and limitations. It’s important to consider the nature of your data and the assumptions made by each method to choose the most appropriate approach for your specific situation.
How to Extrapolate a Graph by Trendline
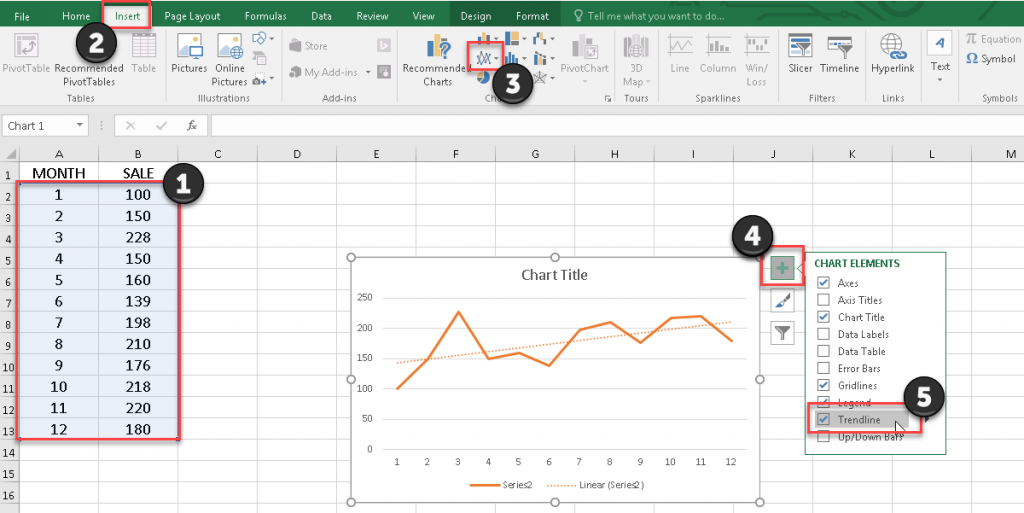
Extrapolating a graph by trendline helps you represent visual data trends. Here we’re going to learn how to add a trendline to our charts:
- Select the data range.
- Go to the Insert tab from the ribbon.
- From the chart section, click on the Line chart (you can pick up the Scatter chart too.)
- Click on the Chart Element icon
 and check the Trendline checkbox.
 - Double-click on the trend line of the graph to open the Format Trendline pane and apply your custom setting.
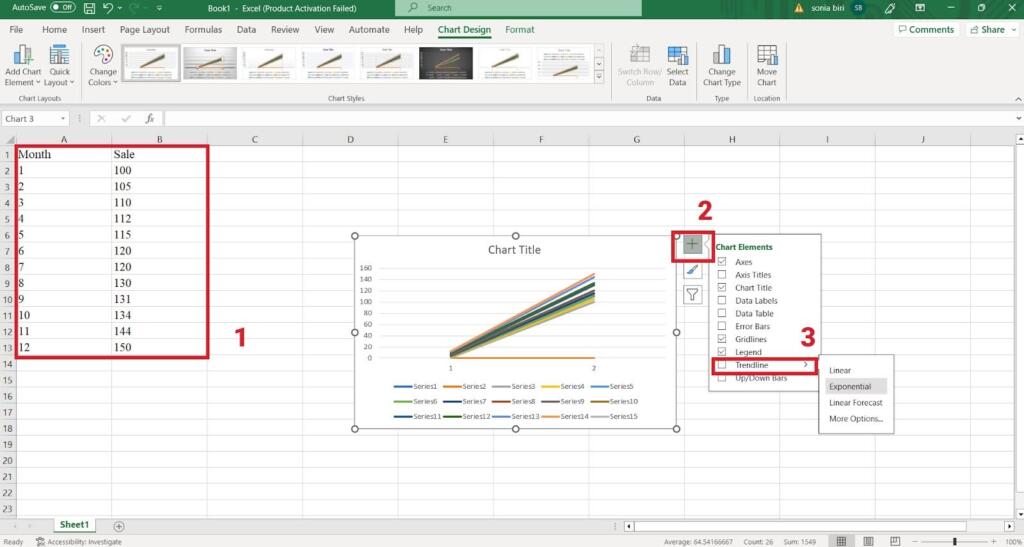
How to Extrapolate Nonlinear Data by Trendline
When you have a nonlinear dataset, you need to detect the data change trend using a trendline and then forecast the desired value. Here’s how you can do it:
- Draw a scatter plot.
- Click on the Chart Element icon and check the Trendline checkbox.
- Double-click on the trend line of the graph to open the Format Trendline pane.
- Add different types of trendline (exponential, logarithmic, and polynomial) to the chart and check “Display R-squared value on chart” and “Display Equation on Chart” boxes.
To determine the best trendline look at the R-squared value. The highest R-squared value shows the best trendline for your data. - put x in the equation shown in the chart.
Choose The Best Trendline
When you have a data set, you need to detect the data change trend and forecast them in a graph.
Point: Do not use trendlines for Radar, Pie, Doughnut, Bubble, and 3D graphs.
In Excel, we have six types of trendlines.
- Exponential
- Linear
- Logarithmic
- Polynomial
- Power
- Moving Average
Exponential
When data values rise or fall at increasingly higher rates, and there are no zero or negative Y values, we use the Exponential trendline.
Linear
When your plotted data set is similar to a line, in other words, when the data is increasing or decreasing at a steady rate, use the Linear trendline.
Logarithmic
When you have a swift data decrease or increase, use the Logarithmic trendline. The data could be negative or positive. Invalid for zero or negative X values.
Polynomial
Assume you have a large data set that is analyzing gains and losses. Fluctuation is the main reason for using this trendline.
Power
This trendline is used when you compare measurements that increase at a specific rate. Invalid for zero or negative X values.
Moving Average
This trendline uses the average of the particular number of data points by the Period option.
Data Extrapolation by the Forecast Function
If you need a function to predict your data without creating charts and graphs in Excel, use the Excel Forecast function. The Forecast function helps you extrapolate numerical data over a linear trend. Also, you can extrapolate a periodical template or even extrapolate a sheet.
Here we’re going to learn how to use the Forecast.linear, and the Forecast.ETS functions and how to extrapolate a sheet.
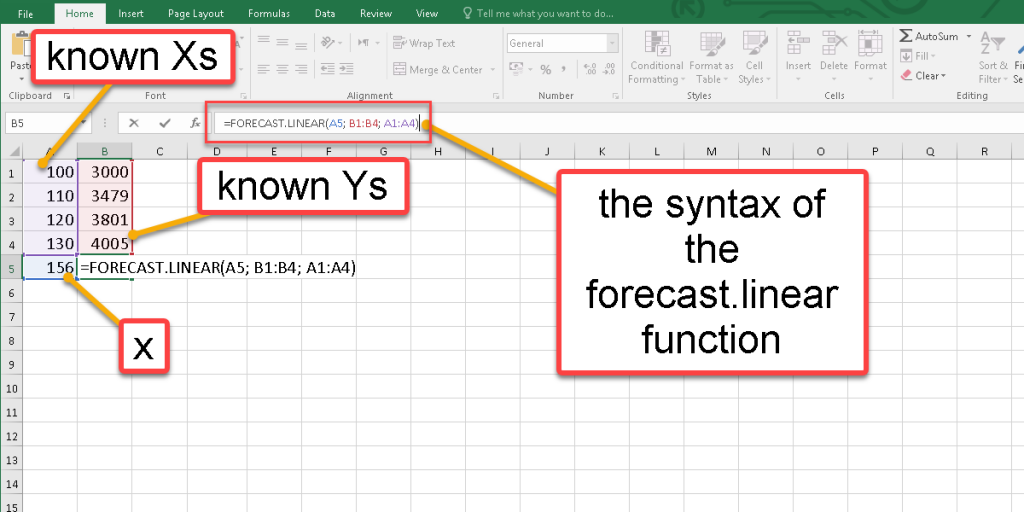
Forecast.Linear
Extrapolation adjudges that the relationship between known values will also apply to unknown values. This function helps you extrapolate data that contains two sets of numerical values which correspond to each other.
Below is the Syntax of the Forecast.Linear function:
=FORECAST.LINEAR(x؛ known Ys؛ known Xs)
Assume we have a set of data that shows the number of sales for nine-month. We need to predict sales for the next three months. To use this function, follow these steps:
- Select an empty cell.
- Enter the =forecast or the =forecast.linear in the Formula Bar.
- Click on the x value you want to predict for itself, and enter a semicolon or comma(according to your Excel version.)
- Select all known Ys, enter a semicolon, and then select all known Xs.
- Press Enter.
Possible Error
#N/A: If the size of the known_Ys and known_Xs is not equal, or if one or both are empty, This error will occur.
#DIV/0: If the variance of the known_Xs is equal to zero, this error will occur
#VALUE: If the input x is non-numeric, This error will occur. Click on the link if you want to know more about Excel formula errors and why they happen.
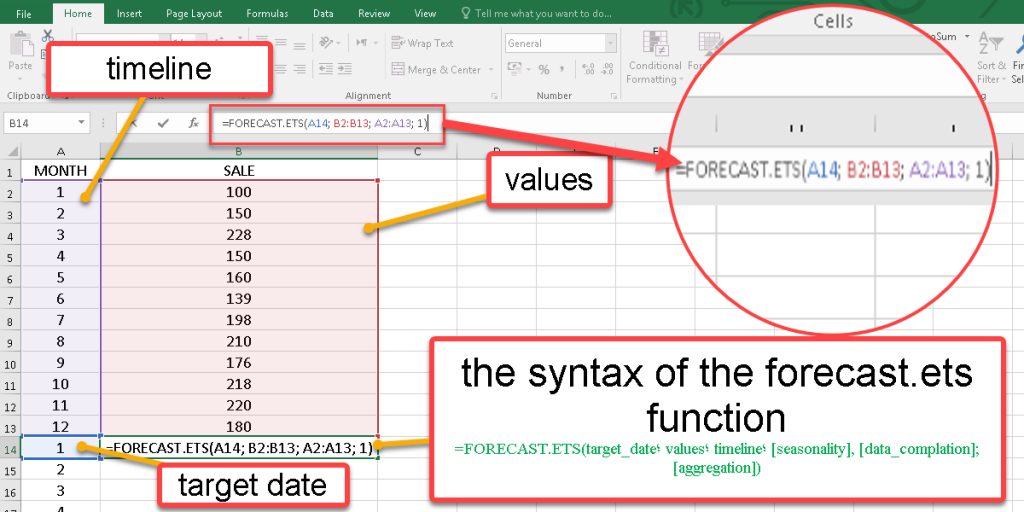
Forecast.ETS
In some cases, you have a seasonal pattern, and this periodical template needs a particular function to forecast the future. Here we have a sales amount for a year, and we need to predict the first three months of the next year.
The syntax of the Forecast.ETS function is:
=FORECAST.ETS(target_date؛ values؛ timeline؛ [seasonality], [data_complation]; [aggregation])
Target_date: The point you need to forecast.
Values: Here are all known sales amounts.
Timeline: In this case, the number of months.
[seasonality]: The length of the seasonal pattern (optional argument.)
[data_complation]: Although the timeline requires a constant step between data points, FORECAST.ETS supports up to 30% of missing data and will automatically adjust for it (optional argument.)
[aggregation]: The aggregation parameter is a numeric value indicating which method will be used to aggregate several values with the same timestamp (optional argument.)
Now follow these steps to forecast your target values:
- Select an empty cell where you want to represent the result.
- Enter the syntax of the function and enter the arguments, as we mentioned.
- Press Enter.
Possible Errors
#N/A: If the values and timeline arrays have different sizes, this error is returned
#VALUE: If any of the seasonality, data completion or aggregation arguments is non-numeric, this error will occur.
#NUM: This error will be returned if the seasonality exceeds 87600, the data completion value is anything other than 0 or 1, aggregation value is not valid (any non-integer number or out of 1-7 range), or the function cannot detect a consistent step size in the timeline. If you want to know more about Excel formula errors and why they happen, click on the link.
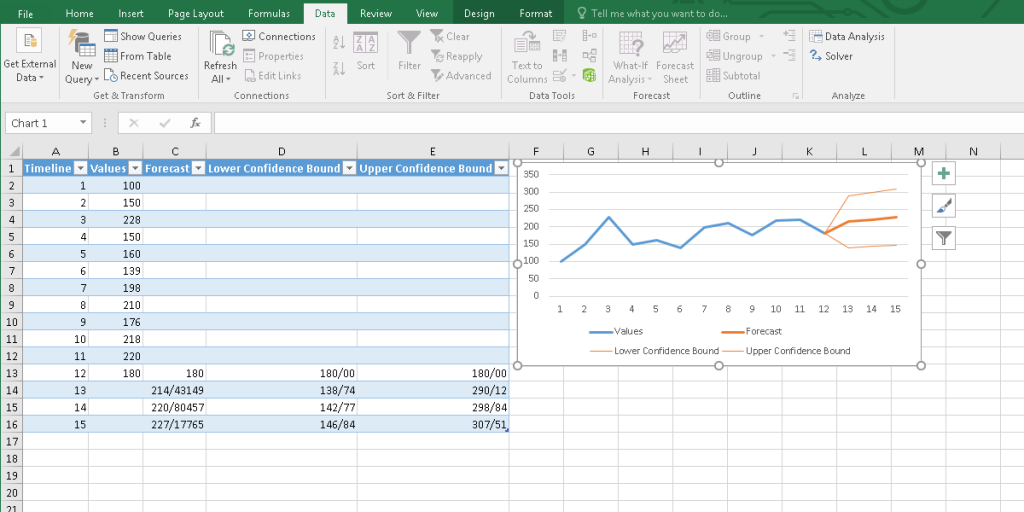
Extrapolating Sheets
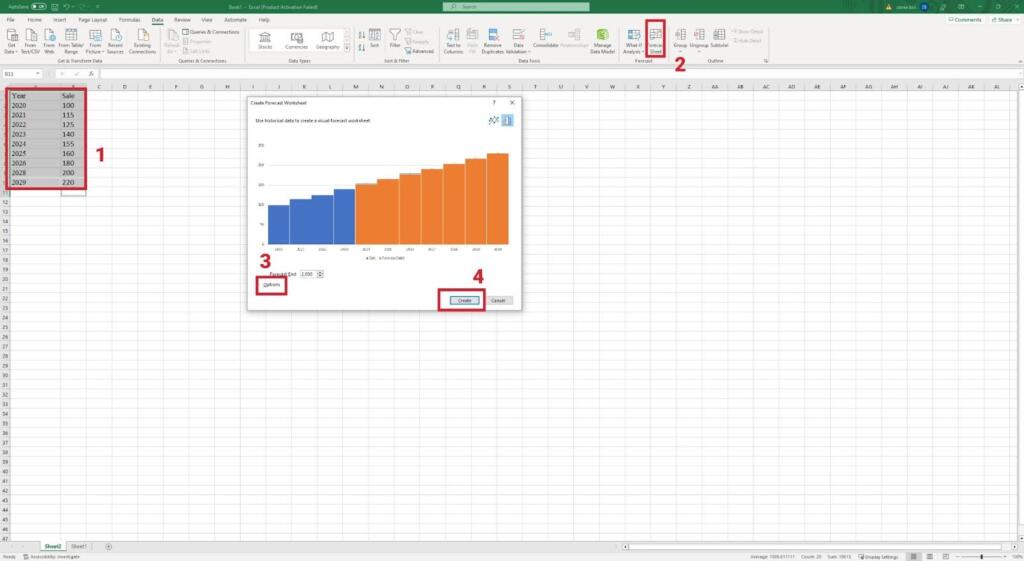
Excel 2016 and later versions provide a tool to forecast the sheet. This tool creates a table according to your data and determines the lower and upper confidence bound.
To use the Forecast Sheet, go to the Data tab from the Forecast group, and click on the Forecast Sheet tool to open the Create Forecast Worksheet box. You can pick a line chart or column chart by their icons in the top right corner of the box.
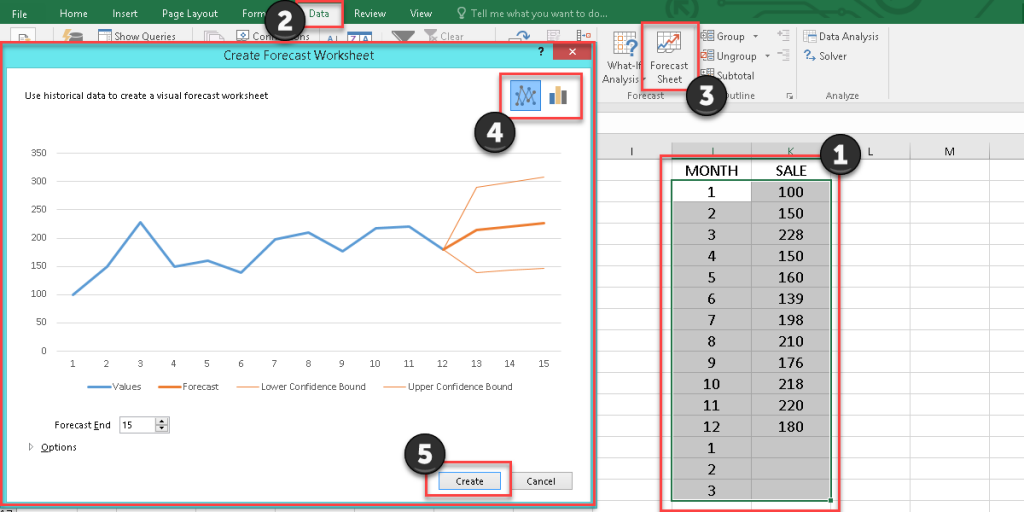
If you need to customize the forecast chart, you can edit it by clicking on the options:
- Where the Forecast starts or ends
- Change the confidence interval
- Add the Forecast statistics
- Change the Timeline and Values range
- And aggregate duplicate using
Then press the Create button and see the result.
Excel Trend Function
Another function to extrapolate data without plotting graphs is the Trend function in Excel. This statistical function is going to predict future trends according to the known values based on linear regression.
The syntax of the Trend function:
=TREND(known_Ys; [known_Xs]; [new_Xs]; [const])
Known Ys: The Y values we already know.
Known Xs: The X values we already know (optional argument.)
Const: according to Y=mX+b, if const is false, b is zero, but if const is true or skipped, b is calculated normally.
Possible Errors
#REF!: If known_Xs and known_Ys arguments have different sizes, this error occurs
#VALUE: This error occurs if you enter a non-logical value as the const argument, or you enter a non-numeric value as the function’s other arguments. Click on the link if you want to know more about Excel formula errors and why they happen.
Summary
Extrapolation in Excel is a valuable technique that empowers users to make predictions and estimate values outside the range of known data.
This comprehensive guide titled “How to Extrapolate in Excel with Formula” aims to equip readers with the knowledge and skills necessary for effective data analysis and forecasting.
By leveraging Excel’s powerful functions and tools, users can extend trends, forecast future outcomes, and make informed decisions based on projected values.
You can connect with us, ask our experts if you have any inquiries, and get more support via Excel Support Services.
Also, reduce costs, accelerate tasks, and improve quality with Excel Automation Services.
FAQ
Generally, extrapolation is not so reliable because we cannot be sure that the data trend will continue out of our data range. In addition, there is nothing to check how accurate our prediction is. However, when our original data is very consistent, we can rely on extrapolation.
Regression is the mathematical process of finding a line or curve that fits the data. Once you find the proper line or curve, you can predict the unknown value based on its equation.
When working with time series, both of them return the same result since they use the same mathematical method.
The difference between these two is that the FORECAST function works only as a regular formula returning one value as output. In contrast, the TREND function can be used as an array formula and calculate multiple y values corresponding to multiple x values.
Our experts will be glad to help you, If this article didn’t answer your questions. ASK NOW
We believe this content can enhance our services. Yet, it’s awaiting comprehensive review. Your suggestions for improvement are invaluable. Kindly report any issue or suggestion using the “Report an issue” button below. We value your input.


