Mastering Data Cleaning in Excel
- What is Data Cleaning?
- Benefits of Clean Data
- Tools and Techniques for Cleaning Data in Excel
- Crucial Considerations Before Cleaning Data in Excel
- Steps to Cleaning Data in Excel
- Common Data Quality Issues
- Strategies for Handling Missing Data in Excel
- Strategies for Handling Duplicates in Excel
- Strategies for Handling Inconsistent Data in Excel
- Strategies for Detecting and Handling Outliers in Excel
- Data Validation and Quality Control in Excel
- Documenting Data Cleaning Steps
- Conclusion
According to IBM, bad data costs businesses 3.1 trillion annually in the US only. In today’s data-driven world, data cleaning is a critical process that underpins the reliability of our analyses and the quality of our decision-making. Cleaning data is a major step in Exploratory Data Analysis. This article serves as a comprehensive guide to mastering data cleaning in Excel. We will explore the importance of data cleaning in Excel, common data cleaning tasks, essential tools and techniques in Excel, step-by-step processes for handling missing data, removing duplicates, and more. By the end of this guide, you’ll have the skills and knowledge to transform messy data into valuable insights, enhancing the accuracy and credibility of your work. Let’s embark on this journey of data cleaning excellence.
What is Data Cleaning?
Data Cleaning is the process of correcting or removing errors, messy formatting, duplicates, and incomplete, irrelevant, and inconsistent information in a dataset.
The goal is to have a dataset that is accurate, complete, consistent, coherent, conforming, relevant, and reliable.
Benefits of Clean Data
Cleaning data offers significant advantages for analysis:
- Accurate Analysis: clean data ensures trustworthy results. Eliminating errors, duplicates, and inconsistencies instills confidence in your data-driven conclusions.
- Improved Decision-Making: Clean data forms a reliable foundation for informed choices, increasing the likelihood of positive outcomes.
- Enhanced Data Visualization: Clean data is easier to visualize, enabling clear and impactful charts, graphs, and reports that convey insights efficiently.
- Efficient Operations: Clean data streamlines business operations by reducing error correction, information search, and reconciliation efforts. This saves a lot of frustration and frees up time for more valuable tasks.
- Lower computation cost: A cleaned dataset is more consistent and less complex. This makes the data computationally more effective to process.
Tools and Techniques for Cleaning Data in Excel
Excel offers a comprehensive toolkit for data cleaning, encompassing functions, features, and techniques.
Cleaning Data Using Excel Functions
- TRIM: Eliminates leading/trailing spaces.
- CLEAN: Removes all nonprintable characters from text.
- CODE: Returns a numeric code for the first character in a text string.
- LEFT: Returns a specified number of characters from the left side of a string.
- RIGHT: Returns a specific number of characters from the right side of a string.
- MID: Returns a specific number of characters from the middle of a text string.
- CONCAT, CONCATENATE: Combines the text from multiple ranges and/or strings. (CONCAT replaces the CONCATENATE function. However, the CONCATENATE function will stay available for compatibility with earlier versions of Excel.)
| If you’re looking to learn more about Excel’s CONCATENATE function, check out our blog post on ‘How To Concatenate In Excel | 3 Simple Ways‘ for a step-by-step guide. |
- TEXTJOIN: Combines the text from multiple ranges and/or strings, and includes a delimiter you specify between each text value that will be combined. If the delimiter is an empty text string, this function will effectively concatenate the ranges.
- LEN: Returns the number of characters in a text string.
- IS functions: A collection of functions that check the specified value and return TRUE or FALSE depending on the outcome.
- VALUE: Converts a text string that represents a number to a number.
- TEXT: Changes the way a number appears by applying formatting to it with format codes.
- UPPER: Converts text to uppercase.
- LOWER: Converts text to lowercase.
- SUBSTITUTE: Replaces characters.
- FIND: Substitutes new_text for old_text in a text string.
- VLOOKUP: Retrieves values from tables.
- IF: Performs logical tests.
Data Cleaning Using Excel Features
- Remove Duplicates: Eliminates duplicate rows.
- Filter and Sort: Filter and sort data based on predefined criteria.
- PivotTables: Enhances data summarization.
- Formulas: For error identification and correction.
- Conditional Formatting: For highlighting cells according to preset rules
- Data Validation Toolset: To prevent erroneous entries and highlight invalid data.
- Text to Column: Takes text in one or more cells and splits it into multiple cells
Boost your productivity by getting a free consultation from Excel experts, and discover tailored solutions to optimize your data management and analysis.
Crucial Considerations Before Cleaning Data in Excel
Recognize the Context of the Data: This is essential to avoid misinterpreting data points and ensure that cleaning aligns with the dataset’s unique characteristics for optimal results.
Understand the Data: It helps identify issues like missing values, outliers, and inconsistencies, forming the basis for accurate data cleaning.
Back up Data Before Cleaning: Always remember to back up your data before cleaning. Remember! Never perform cleaning on the original dataset.
Steps to Cleaning Data in Excel
While there’s no one-size-fits-all approach to data cleaning, a systematic method is essential for consistency and effectiveness. To clean data effectively in Excel, follow these steps:
- Import your data from various sources into Excel. Consider using Excel’s data consolidation [link to data consolidation in Excel blog] and Combine/Merge features in this step.
- Understand your data by examining its structure and identifying missing values, duplicates, and inconsistencies.
- Handle missing data by deciding whether to delete or fill in missing values.
- Remove duplicates to keep unique records.
- Address inconsistencies in text, date, and numerical data using Excel functions.
- Use Data Validation to set rules for data entry and prevent errors.
- Perform quality checks, calculate summary statistics, and manage outliers.
- Create a clean dataset in a new worksheet and save it.
- Document your data cleaning process and the transformations made.
- Proceed with data analysis and reporting confidently using your cleaned dataset.
Common Data Quality Issues
- Missing Data Records: Incomplete data, like missing ZIP or area codes, can lead to flawed analyses. Enforcing mandatory field completion, flagging incomplete records, and supplementing missing data with external sources can address this issue.
- Duplicates: Duplicate records or entries occur when the same data appears more than once. Duplicates can distort statistical analyses, inflate counts, and skew results, affecting the accuracy of reports.
- Inconsistencies: Inconsistent data may have variations in formatting, units of measurement, or coding schemes. These inconsistencies can lead to misinterpretations and hinder meaningful comparisons during analysis.
- Outliers: Outliers are data points significantly different from the rest and can result from errors or legitimate rare events. They need attention during data analysis and may require further investigation or handling.
In the upcoming sections, we will address these issues in more detail and suggest solutions for resolving them in a structured way.
Strategies for Handling Missing Data in Excel
Dealing with missing data is crucial in data analytics, and the method chosen depends on factors like data type and analysis objectives. Common approaches are:
- Deletion: Deleting rows or columns with missing data simplifies the dataset but may lead to valuable information loss. Caution is needed, especially if the missing data is significant.
- Imputation: Excel offers functions like mean, median, or mode to replace missing values with estimates. Advanced techniques like regression analysis can be used for more accuracy when variable relationships are known.
- Interpolation: In ordered date or time series, interpolation estimates missing values based on neighboring data points.
Pitfalls in Dealing with Missing Data
- Biased Results: Ignoring missing data can lead to biased results, as the missing values might not be random and could represent a particular subgroup.
- Loss of Information: Deleting rows or columns with missing data can result in a significant loss of information, reducing the dataset’s representativeness.
- Inaccurate Imputation: Imputing missing values with incorrect methods can introduce errors and distort the analysis.
- Overimputation: Overimputing missing data by filling in too many values can lead to overfitting and false results.
Best practices in dealing with missing data
- Understand why data is missing
- Use appropriate statistical methods for imputation
- Consider multiple imputations for uncertainty
- Document the process
- Conduct sensitivity analysis
- Seek input from subject matter expert
- Consider collecting more data (if feasible)
- Report proportions of missing data and handling process in the research findings
Strategies for Handling Duplicates in Excel
Duplicate data can either serve a purpose or complicate data comprehension. In the following, we will cover the basics of finding and removing duplicates while cleaning data in Excel.
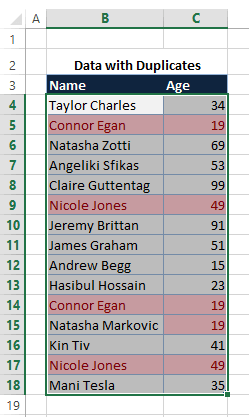
How to Find Duplicate Values in Excel
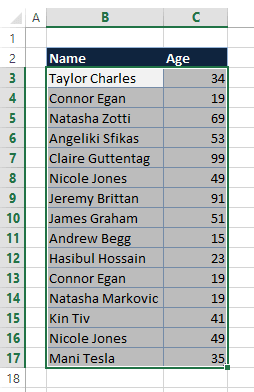
Employ conditional formatting to detect and emphasize duplicate data, allowing for a review to determine whether removal is necessary.
- Highlight the cells requiring duplicate checks.
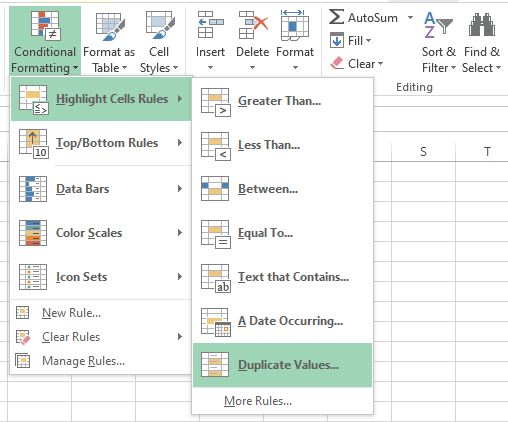
- Navigate to Home > Conditional Formatting > Highlight Cells Rules, and click Duplicate Values. The Duplicate Values dialog box will open.
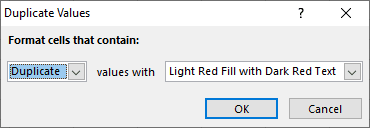
- In the values with box choose the desired formatting for duplicate values, and proceed by clicking OK.
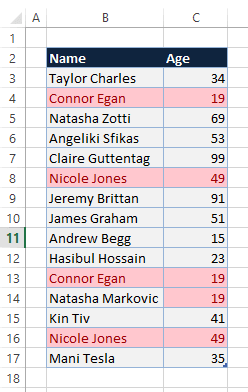
You can see all duplicate values highlighted in the format you defined earlier.
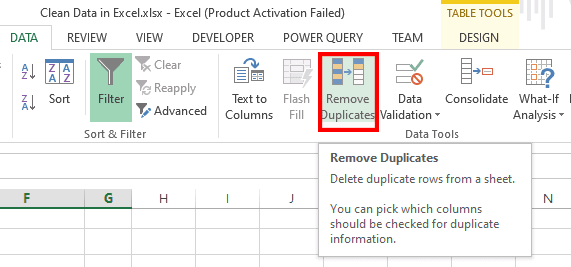
How to Remove Duplicate Values in Excel
Note: When utilizing the Remove Duplicates feature in Excel, please be aware that duplicate data will be removed permanently. To safeguard against inadvertent data loss, it is advisable to duplicate the original data onto a separate worksheet.
- Highlight the cell range containing the duplicate values you intend to eliminate.
Ensure your data does not contain any outlines or subtotals before attempting to remove duplicates.
2. Go to the Data tab > Remove Duplicates to open the Remove Duplicates dialog box.
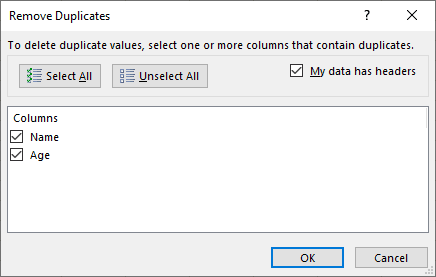
- You can see that duplicates are removed according to the columns you selected in the previous step.
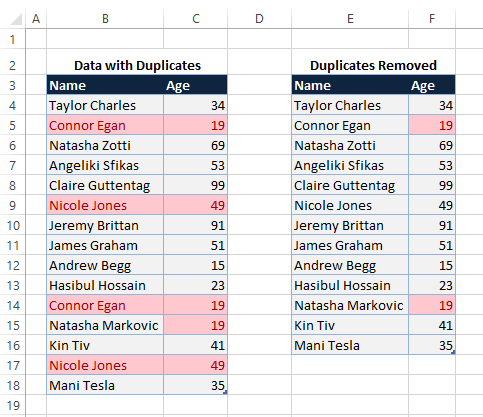
| If you want to streamline your Excel worksheets and remove duplicate data, don’t miss our comprehensive guide on ‘How To Remove Duplicates In Excel‘ for easy-to-follow instructions. |
Strategies for Handling Inconsistent Data in Excel
Identifying and addressing data inconsistencies is a critical step in cleaning data in Excel. To achieve this try to understand the data’s expected format and structure; this will help you discriminate consistency from inconsistency.
Removing Extra Spaces
- Remove leading, trailing, and extra spaces between words
In the following screenshot, cell B2 contains “ Ana N Nobil “. We use the TRIM function to remove extra spaces between words and also leading and trailing spaces.
- Removing all spaces between words
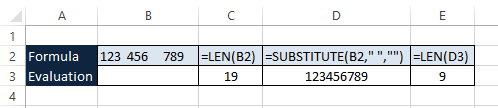
In the following screenshot, cell B2 contains “123 456 789,” and we need to remove all spaces. To that end, we use =SUBSTITUTE(B2, “ “,””) function, meaning replace each space with nothing!
Standardizing Text Formatting
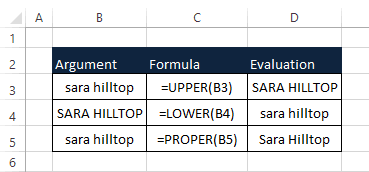
- Convert all text to uppercase, lowercase, or proper case
Enhance your software capabilities with our customizable Add-In Solutions, seamlessly integrating new features to meet your business needs.
Strategies for Detecting and Handling Outliers in Excel
Identifying outliers in data is a crucial step in having clean data in Excel spreadsheet, and deciding whether to keep or remove them depends on several factors.
Deciding Whether to Keep or Remove Outliers
The decision to keep or remove outliers depends on many factors, including:
- The nature of the data: Consider whether outliers represent natural variability (keep in large datasets) or data errors (remove to prevent distortion).
- Your analysis goals: Removing outliers can lead to more robust results if your analysis is sensitive to them. Assess whether outliers significantly affect your intended conclusions.
- The context of your data: Including domain knowledge and the significance of outliers in your field. Document your decision if you choose to remove outliers.
- The size of your data: In smaller datasets, removing outliers may reduce sample size and statistical power. In such cases, alternative statistical methods may be necessary.
Here are some standard methods for identifying outliers and guidance on handling them:
- Visual Inspection: Visualizing your data through scatter plots, histograms, or box plots can often reveal outliers. Outliers will appear as data points far away from the bulk of the data.
- Z-Scores: Calculate the z-scores for your data points. Z-scores measure how many standard deviations a data point is away from the mean. Data points with z-scores greater than 3 or less than -3 are typically considered outliers.
- Interquartile Range (IQR): Calculate the IQR, which is the range between the first quartile (Q1) and third quartile (Q3) of your data. Data points outside the range Q1 – 1.5 * IQR to Q3 + 1.5 * IQR are considered outliers.
Data Validation and Quality Control in Excel
Data validation within Excel serves as a method to control and restrict the type of information users can input into a worksheet. It is a commonly employed tool to set constraints on data entries. They serve several vital purposes:
- Ensuring Data Accuracy: Validation rules and quality control checks help maintain data accuracy by identifying and rectifying errors, inconsistencies, and missing values. This accuracy is fundamental for producing reliable results and making informed decisions.
- Data Integrity: By enforcing validation rules and quality checks, data integrity is preserved. This means the data remains reliable, consistent, and trustworthy throughout its lifecycle.
- Cost Savings: Detecting and addressing data quality issues early in the data lifecycle can save organizations significant costs associated with data errors and their consequences.
Documenting Data Cleaning Steps
Documenting data cleaning steps is crucial for maintaining data integrity and ensuring transparency in your data analysis process.
The importance of documenting the data-cleaning process
Transparency and reproducibility are foundational principles in data analysis and research, particularly in scientific contexts and data-driven decision-making.
Transparency involves openly sharing research methods, data collection, cleaning, analysis, and interpretations. It entails making raw data and analysis code accessible for scrutiny and peer review, ensuring accountability and research integrity.
Reproducibility, on the other hand, entails the ability to recreate research results independently by following the same procedures and using the same data.
It validates research findings, supports independent verification, and serves as a basis for building on previous work. Additionally, reproducibility aids in error detection, as inconsistencies may prompt a closer examination of methodology or data.
Together, transparency and reproducibility enhance the credibility, reliability, and robustness of data analysis and research, playing a pivotal role in fields where data-driven decisions have substantial consequences, such as healthcare, policymaking, and scientific advancements.
Methods for Keeping a Clean Data Log
Here’s a guideline on how to document your data-cleaning steps effectively:
Determine the essential data for logging: which information aligns with your objectives and is crucial to track? Once you’ve identified the necessary data, establish a consistent template or spreadsheet for systematic tracking.
Establish a data logging system that suits your needs: whether it involves manual data entry into a spreadsheet, utilization of dedicated data logging software, or automation via scripts or APIs. Choose an approach that aligns with your preferences and maintenance capabilities.
Maintain a regular data logging routine: avoid delays in recording data; ensure it’s logged promptly after the occurrence. This practice enhances the accuracy and timeliness of your data.
Periodically review your data log: allocate time weekly or monthly to assess your data log. This aids in uncovering potential trends or patterns that might have gone unnoticed.
Organize your data log meticulously:
- Employ clear labeling for columns and rows.
- Maintain uniform formatting.
- Implement regular data backups to prevent data loss.
Conclusion
In conclusion, mastering data cleaning in Excel is essential for ensuring the accuracy and reliability of your data analysis and decision-making processes.
Following the step-by-step guide in this article, you can effectively address common data cleaning tasks, handle missing data, remove duplicates, clean text and formatting, tackle inconsistencies, and detect outliers.
Implementing data validation rules and maintaining a clean data log further enhances the integrity of your data. Remember that transparent documentation of your data cleaning steps is crucial for reproducibility and building trust in your analyses.
With these skills and practices, you can transform messy data into valuable insights.
Our experts will be glad to help you, If this article didn’t answer your questions. ASK NOW
We believe this content can enhance our services. Yet, it’s awaiting comprehensive review. Your suggestions for improvement are invaluable. Kindly report any issue or suggestion using the “Report an issue” button below. We value your input.


