How To Calculate Variance In Excel
The Excel statistical functions include the variance, the average (Internal link – how to calculate average in Excel), etc. There are about four hundred functions modified in Excel, and six of them calculate the variance exclusively.
Therefore the Microsoft office Excel software (MS-Excel) helps to reduce the computation time of this index.
In this tutorial, we will learn all these six functions and how to use them based on your data (The most crucial point is that you should know if your data is a sample or population.)
If you’re exploring more advanced mathematical functions in Excel, you might also be interested in learning how to calculate integrals in Excel.
If you’re working with data that involves continuous functions or need to analyze curves, you might also find our guide on calculating the area under a curve in Excel helpful.
The Concept of the Variance
The evaluation of the spread among numbers in a data set is the Variance. Mathematically it’s specified as the average of the squared differences from the mean.
A large variance means numbers in the set are far from the mean and each other, while a small variance demonstrates the opposite.
Learn more: (https://www.mathsisfun.com/data/standard-deviation.html)
Calculating Variance in Excel
Excel variance formulas have two types of calculation:
- The Statistical functions calculate the variance for an entire population. These functions are VAR.P, VARP and VARPA.
VAR.P:
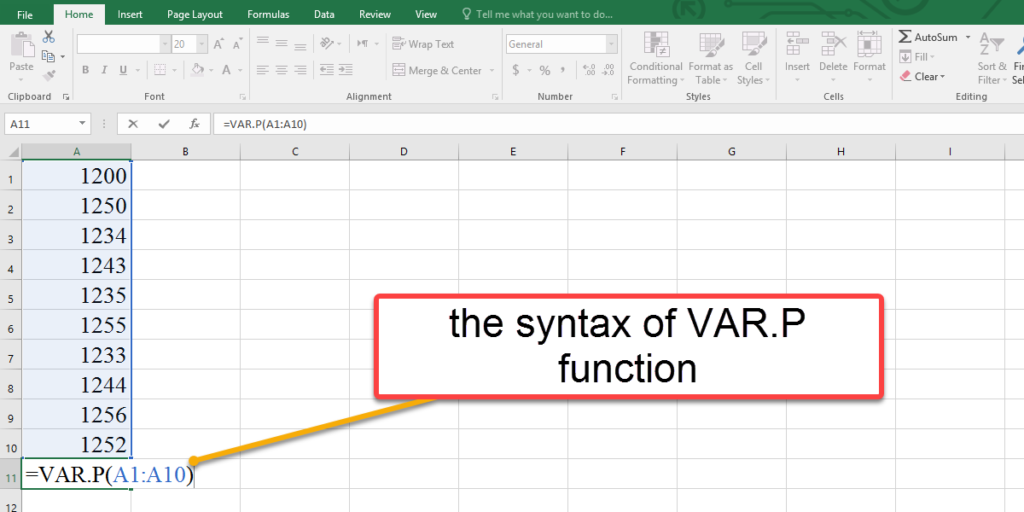
This function calculates the variance of the whole population. By the way, the VAR.P function ignores cells with text and logical values (True or False) in reference.
The syntax of VAR.P function:
=VAR.P(number1, [number2], …)
Number 1: The data (cell, number, etc.) that we want to calculate variance (you can enter the whole range instead of entering the data one by one.)
[number 2], [number 3], … are optional.
Enhance your productivity and efficiency with our comprehensive Excel Automation Services, designed to simplify complex tasks and save you valuable time.
Use the INSERT FUNCTION Option to Calculate VAR.P
All functions are predefined in Excel. To enter the VAR.P formula, apply the following steps:
- Select an empty cell.
- Go to the Formulas tab from the ribbon.
- Click on the Insert Function from the Function Library group.
- In the Insert Function dialogue box, you have two choices to enter the function.
- Search for function (search VAR.P)
- Select the category then select a function (select the Statistical category then select the VAR.P function from the menu.)
- Click OK, then the Function Arguments dialogue box appears.
- Click in the Number 1 box and enter the first data from the reference (number 1, number 2, … are 1 to 255 numeric arguments corresponding to a population.) Also you can enter your whole range in the Number 1 box.
- Press OK.
VARP:
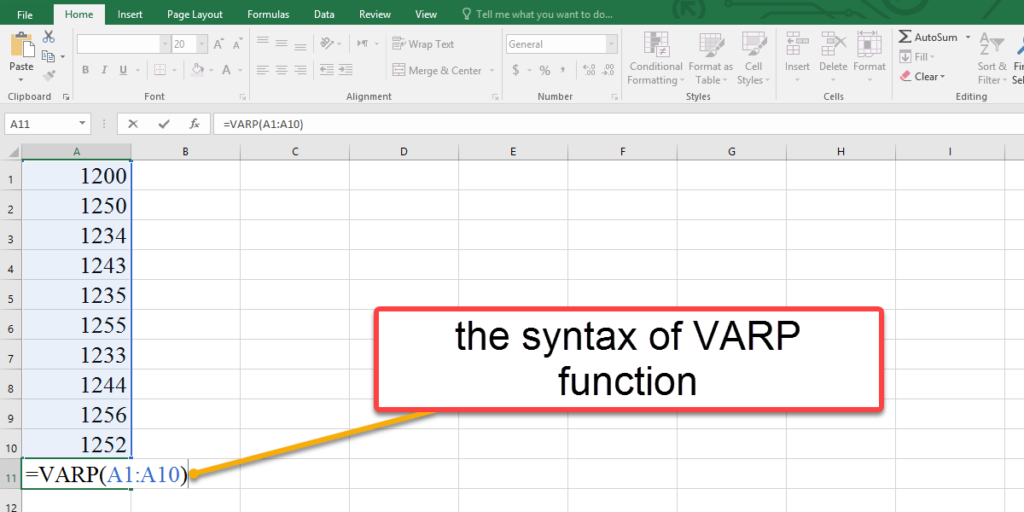
This function is compatible with Office 2016 and previous versions, but In the new versions, the VAR.P was replaced with the VARP. Anyway, there is no difference between these two functions.
The syntax of the VARP function:
=VARP(number1, [number2], …)
Number 1: The data (cell, number, etc.) that we want to calculate variance. (you can enter the whole range instead of entering the data one by one.)
[number 2], [number 3], … are optional.
Use the INSERT FUNCTION Option to Calculate VARP
To enter the VARP formula, execute the following steps:
- Select an empty cell.
- Go to the Formulas tab from the menubar.
- Click on the Insert Function button.
- In the Insert Function dialogue box, you have two choices to enter the function.
- Search for function (search VARP)
- Select the category then select a function (select the Statistical category then select the VARP function from the menu.)
- Click OK, then the Function Arguments dialogue box appears.
- Click in the Number 1 box and enter the first data from the reference (number 1, number 2, … are 1 to 255 numeric arguments corresponding to a population.)
- Press OK.
Unlock valuable insights with our Data Visualization and Data Analysis Services, transforming complex data into clear, actionable strategies for informed decision-making.
VARPA:
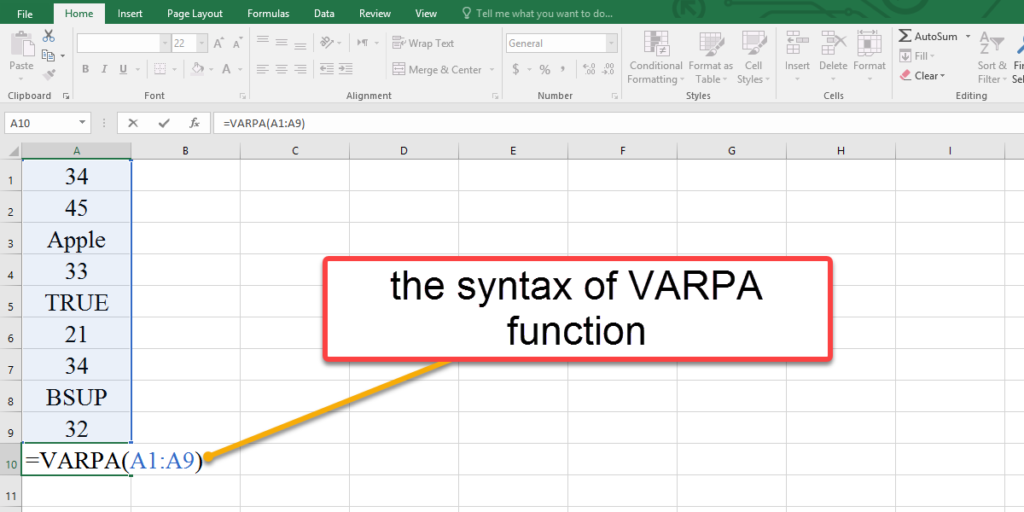
We mentioned that the VARP and VAR.P functions ignore the text (which is evaluated as 0) and logical values (i.e. True or False; The True will be evaluated as one, and the False will be evaluated as zero). Still, the VARPA function returns the variance based on an entire population of numbers, text, and logical values.
The syntax of the VARPA function:
=VARPA(number1, [number2], …)
Number 1: The data (cell, number, etc.) that we want to calculate variance (you can enter values one by one or enter a range.)
[number 2], [number 3], … are optional.
Use the INSERT FUNCTION Option to Calculate VARPA
To enter the VARPA formula, execute the following steps:
- Select an empty cell.
- Hold Shift and press F3 on your keyboard.
- In the Insert Function dialogue box, you have two choices to enter the function.
- Search for function (search VARPA)
- Select the category then select a function (select the Statistical category then select the VARPA function from the menu.)
- Click OK, then the Function Arguments dialogue box appears.
- Click in the Number 1 box and enter the first data from the reference (number 1, number 2, … are 1 to 255 numeric arguments corresponding to a population.)
- Press OK.
- The Statistical functions calculate the variance for a sample. These functions calculate sample variance in Excel: VAR.S, VARS and VARA.
VAR.S:
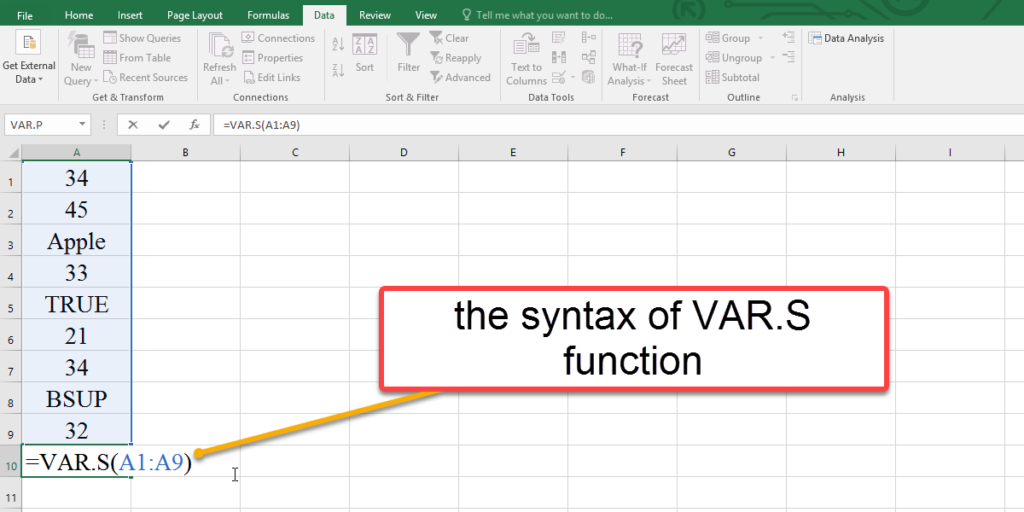
This Excel function calculates the variance of a sample. But ignore cells that contain text and logical values; in other words, the VAR.S evaluate the numbers passed into as cell references.
The syntax of the VAR.S function:
=VAR.S(number1, [number2], …)
Number 1: The data (cell, number, etc.) that we want to calculate variance.
[number 2], [number 3], … are optional.
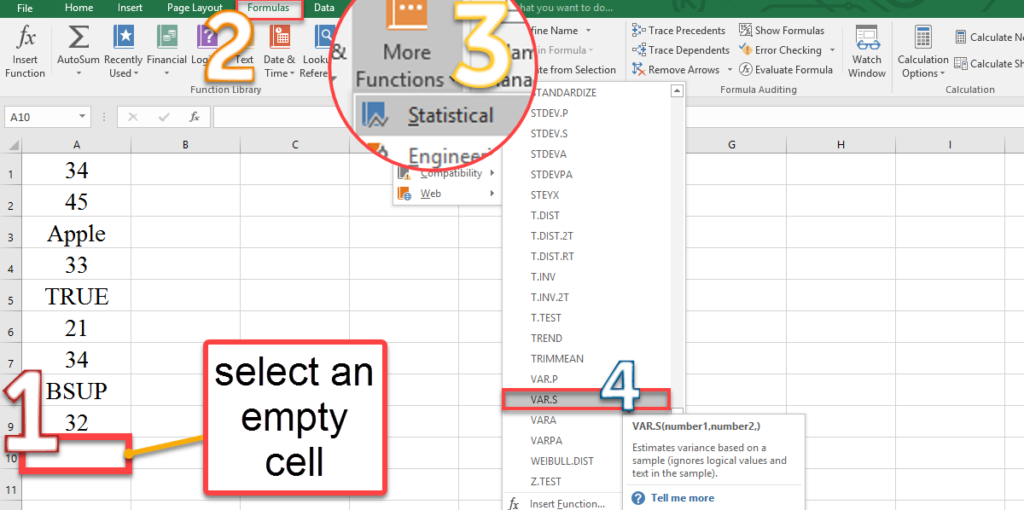
Use the MORE FUNCTION Option to Calculate VAR.S
In addition to using the Insert Function option, you can find your formulas with the following steps.
- Select an empty cell.
- Go to the Formulas tab from the ribbon.
- Click on the More Functions button.
- Select the Statistical from the menu.
- Select the VAR.S function.
- In the Function Arguments dialogue box, Click in the Number 1 box and enter the first data from the reference (number 1, number 2, … are 1 to 255 numeric arguments corresponding to a population.)
- Press OK.
VAR:
All we talked about VAR.S applies for VAR function too. Actually, the VAR.S was replaced with the VAR function in the new versions.
VARA:
The VARA function is able to estimate the sample variance for the data containing text (which is evaluated as 0) and logical values (the True will be evaluated as one, and the False will be evaluated as zero.)
The syntax of the VAR.S function:
=VARA(number1, [number2], …)
Number 1: The data (cell, number, etc.) that we want to calculate variance.
[number 2], [number 3], … are optional.
Also, you can use options like the Insert Function or the More function, as we mentioned, to calculate the VARA function.
How to Calculate the Coefficient of Variance in Excel
In the statistical analysis, the coefficient of variance is a comparing dispersion index of two or more variables. The difference among these variables is the unit of measurement.
Learn more: ( https://en.wikipedia.org/wiki/Coefficient_of_variation )
The coefficient of variation expresses the dispersion rate per unit of the mean. This indicator applies only to the relative measurement level
The general formula in statistical mathematics:
CV= Standard deviation / Mean
The syntax of the population CV function:
=STDEV.P(number1, [number2], …)/AVERAGE(number1, [number2], …)
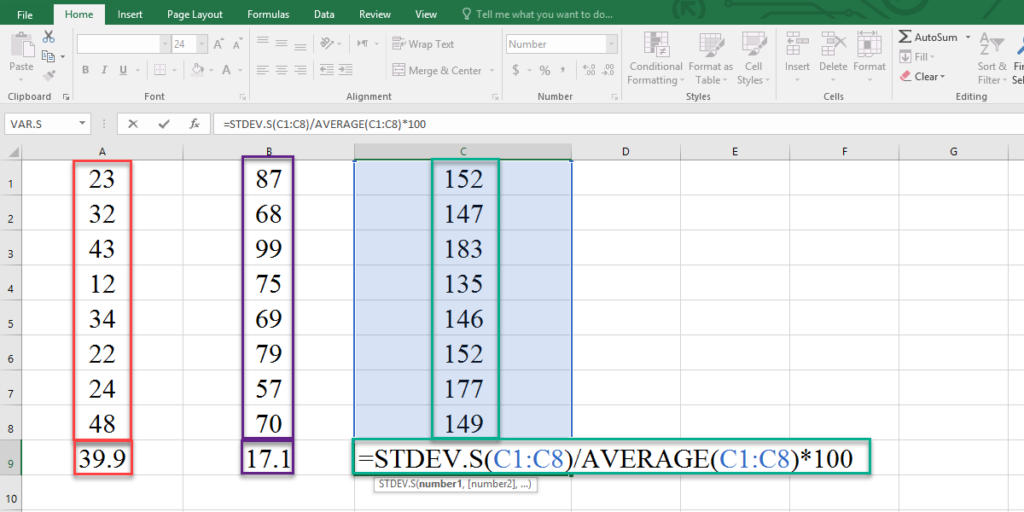
The syntax of the sample CV function:
=STDEV.S(number1, [number2], …)/AVERAGE(number1, [number2], …)
Number 1: The data (cell, number, etc.) that we want to calculate variance.
[number 2], [number 3], … are optional.
Note: Enter numeric data.
Here’s an example that shows how the sample CV function works:
You can connect with us and ask our experts about your questions and get support (bsuite365.com)
Reduce costs, accelerate tasks, and improve quality with Excel automation (bsuite365.com)
Our experts will be glad to help you, If this article didn’t answer your questions. ASK NOW
We believe this content can enhance our services. Yet, it’s awaiting comprehensive review. Your suggestions for improvement are invaluable. Kindly report any issue or suggestion using the “Report an issue” button below. We value your input.


