What is Interpolation and How To Interpolate In Excel
Interpolation is a useful mathematical and statistical method; used to estimate an unknown value of a function between two known values. In this blog, we are going to learn about interpolation and how it’s done in Excel.
What Is Interpolation?
Suppose we have a function with discrete points, and we need a value between two specific values of the function. To estimate this unknown value, we should interpolate. In other words, interpolation is estimating an unknown value between two known values.
The data we are working with is sometimes linear, or approximately linear. In this case, linear interpolation is useful to predict an unknown value. When our data is not linear, linear interpolation does not give an accurate estimation. So we have to look for another solution.
Optimize your workflow and maximize efficiency with our Excel Automation Services, designed to streamline processes and enhance productivity.
Linear Interpolation
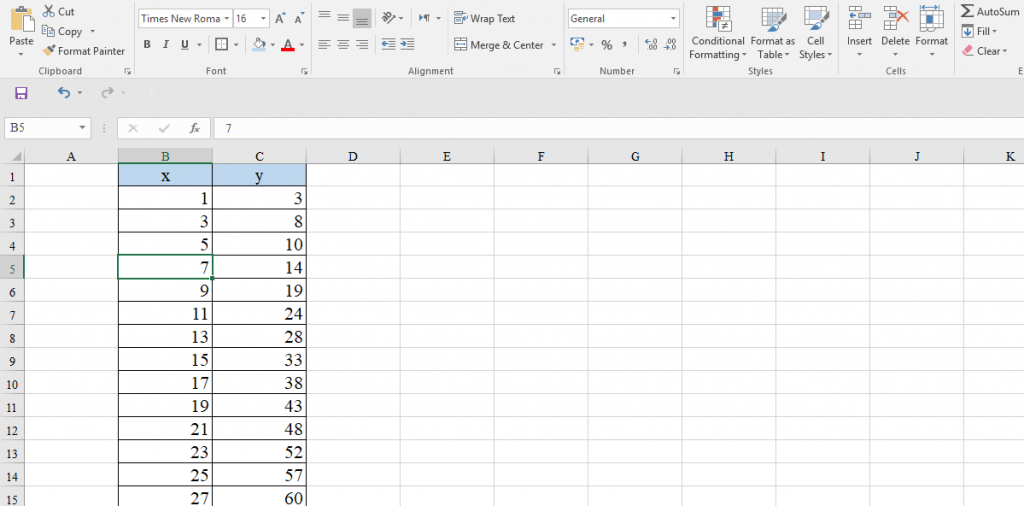
Linear interpolation is the crossing of a straight line between two data points. For example, suppose we have a dataset of x and y values. We need to know the y value corresponding to x=18.1. We will introduce four ways to determine this value. Suppose, we name this point B; we’ll also call the two points that we need for interpolating, A(7,14) and C(9,19).
Mathematical Equation for Linear Interpolation
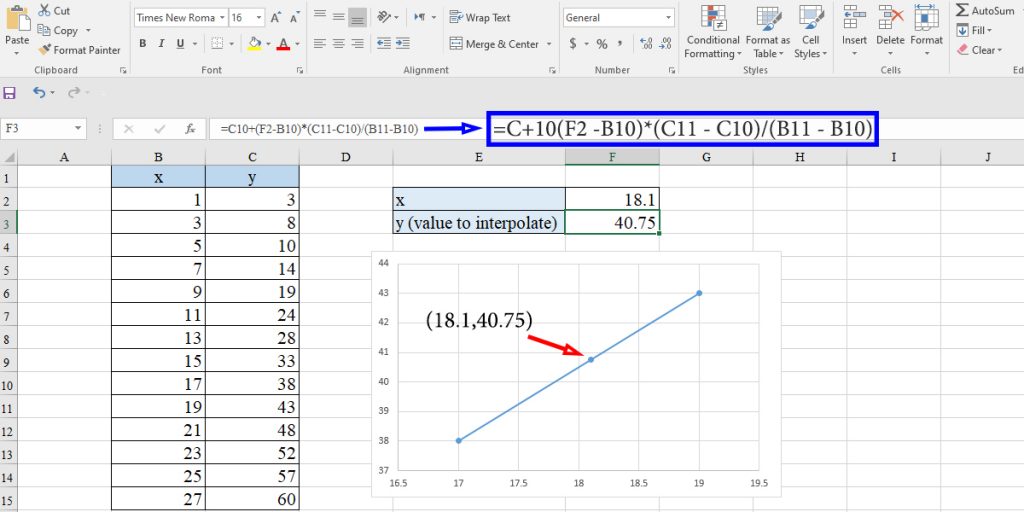
The mathematical equation for this case is as follows:
y= y1 + (x-x1)⨯(y2-y1)/(x2-x1)
We need the value of y corresponding to x, which makes point B(x,y). A(x1,y1) and C(x2,y2) are the two points around B. To find the required y, type the equation above in an Excel cell. For this example:
x1 = 7 , y1 = 14
x2 = 9 , y2 = 19
Look at the following image:
Linear Interpolation Using Trendline
To interpolate a value using this method, we should draw a graph for the data. Then Excel fits a line according to the data and gives its equation through a process called liner regression. Once we have the equation, we can find the value of y by putting x in it. To
- Draw the scatter chart of data
- Add linear trendline to the chart
Design > Add Chart Element > trendline > linear
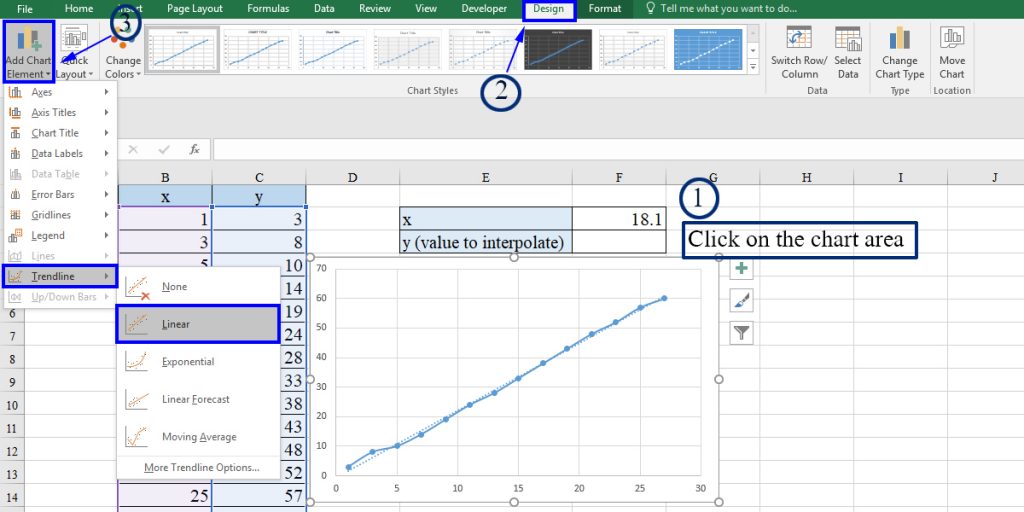
You can also use ![]() icon beside the chart and check the trendline.
icon beside the chart and check the trendline.
3. Get the equation derived from the data by double-clicking on the trendline graph > trendline options > check “Display Equation on chart.”
4. Put x in the equation
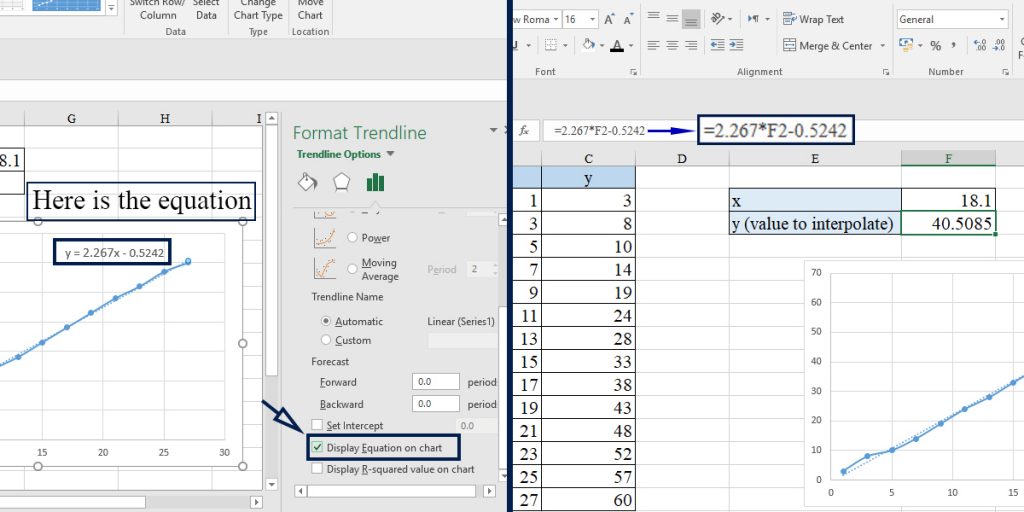
Note: Trendline fits a line through all of the points. We can use the trendline for the two points around the required value. By doing so, Excel crosses a line between points A and C, and that’s what we did in the first method.
SLOPE and INTERCEPT Functions
As mentioned above, the trendline feature uses linear regression to find an equation for the dataset. Now, what if you don’t want to draw the graph and go through the whole process?
Well, there is an alternate method. The SLOPE function is used to calculate the slope of the linear regression equation, and the INTERCEPT function is used to calculate the intercept of the linear regression equation.
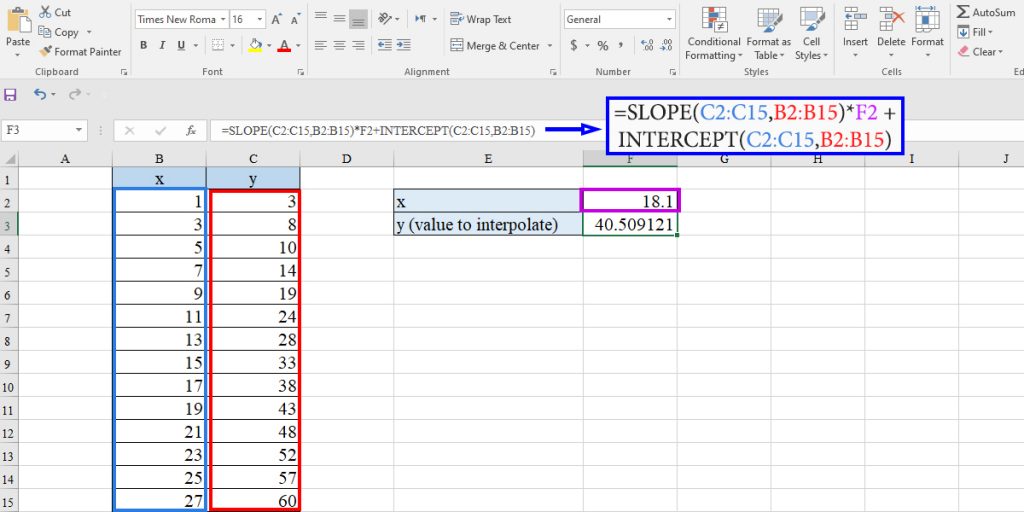
To use these functions for linear interpolation, in our example, type the following equation in a cell:
=SLOPE(C2:C15,B2:B15)*F2+INTERCEPT(C2:C15,B2:B15)
Read the How to Use LINEST Function in Excel blog, to learn more about the SLOPE and INTERCEPT functions.
FORECAST Function
The FORECAST or FORECAST.LINEAR function predicts a value based on linear regression. The FORECAST function takes three arguments.
FORECAST(x,known_y’s,known_x’s)
x : the value for which we want to predict the corresponding y value
known_y’s: the dependent values of the function (y values)
known_x’s: the independent values of the function (x values)
Note: If you are using a version of Excel older than the 2016 version, you can only use the FORECAST function. Microsoft Excel added FORECAST.LINEAR in the 2016 version. It is suggested to use the FORECAST.LINEAR function.
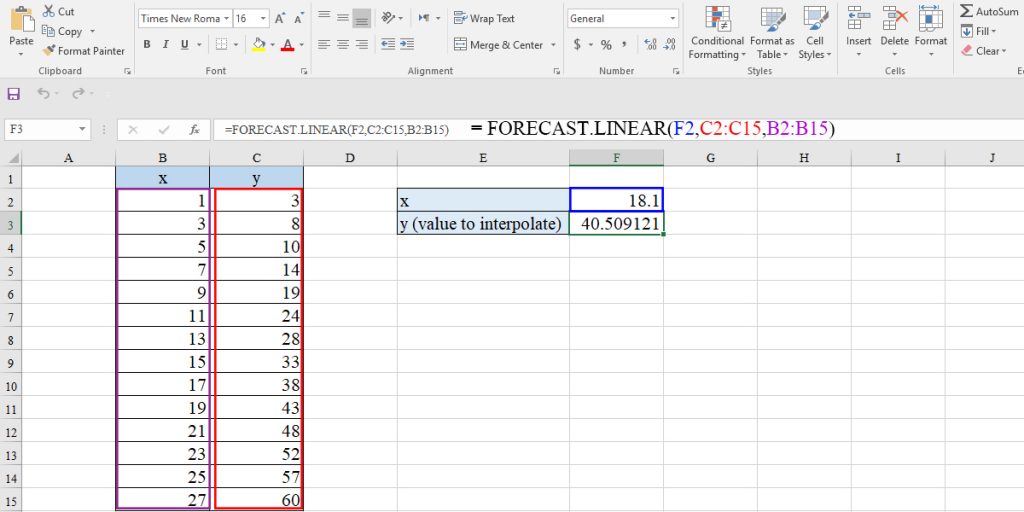
To interpolate using the FORECAST function in our example, type the following equation in a cell:
=FORECAST.LINEAR(F2,C2:C15,B2:B15)
Possible Errors
#N/A: This error will occur if the size of the first and second data sets is not equal, or if one or both sets are empty.
#DIV/0: This error will occur if the variance of the independent values is equal to zero.
#VALUE: This error will occur if the input x is non-numeric.
Click on the link, if you want to know more about Excel formula errors and why they happen.
TREND Function
TREND function gives an unknown value based on linear regression. The syntax of the TREND function is as bellows:
TREND(known_y’s,[known_x’s],[new_x’s],[const])
known_y’s: The set of known y values
[known_x’s]: The range of cells or arrays of x values (optional)
If it’s ignored, Excel will assume the x values are (1,2,3, so on)
[new_x’s]: The value for which we want to predict corresponding y value
This argument is optional too. If the [new_x’s] argument is omitted, it is set to be equal to the [known_x’s].
[const]: this is the function’s logical argument. 1 means that in the equation y=ax+b, b will be calculated normally. And 0 means it is set to zero.
Note: although these arguments are optional when we need to interpolate to find out an unknown value, we have to use them.
Nonlinear Interpolation
When the data is not linear, the first thing we have to do is to find out the function’s behavior.
Nonlinear Interpolation Using Trendline
Excel can fit exponential, logarithmic, and polynomial equations to the data. Let’s discuss it with an example:
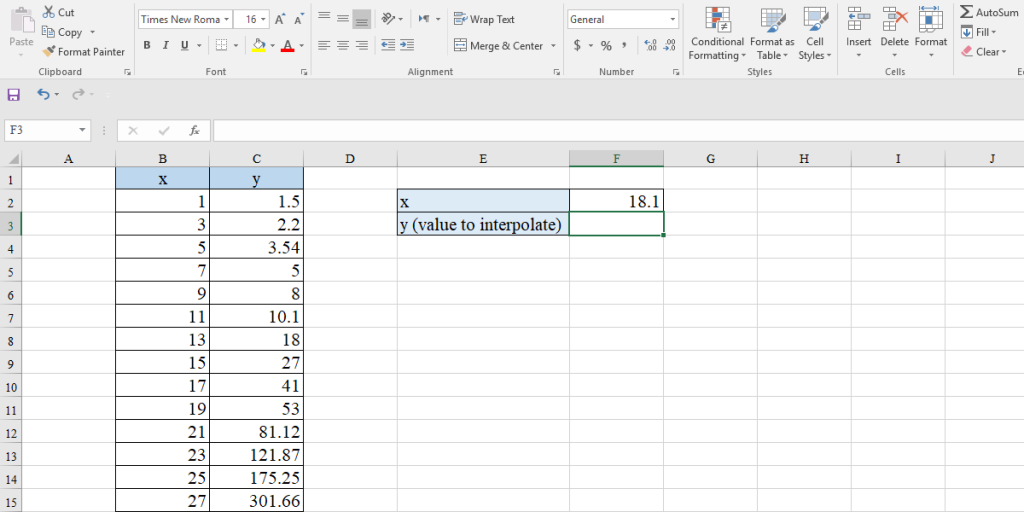
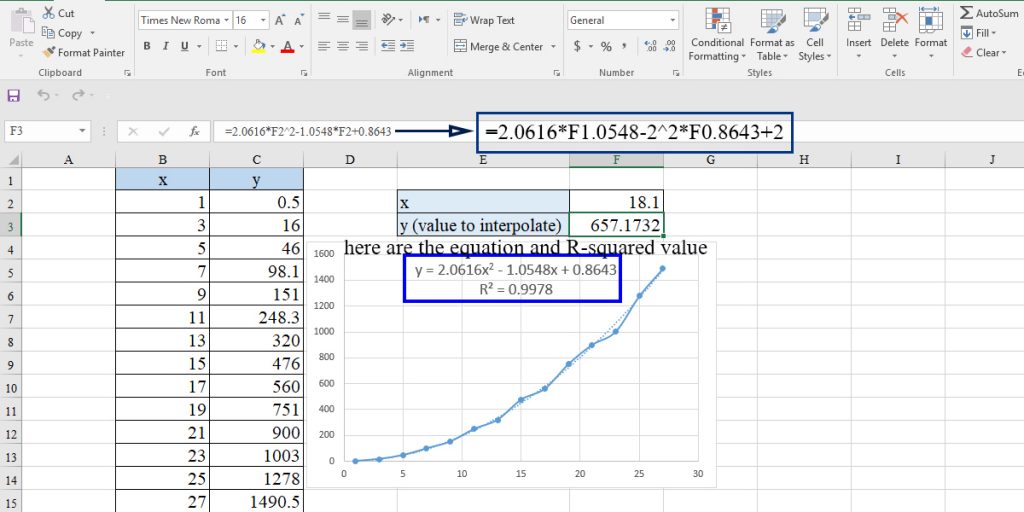
We have a dataset of x and y values, and we want to predict the corresponding value to x = 18.1. First of all, we need to find out the best equation that can describe our data. So we use trendline using these steps:
1. Draw the chart
2. Add different types of trendline (exponential, logarithmic, and polynomial) to the chart
Design > trendline > more trendline options.
In the “format trendline” window, select the trendline type and check “Display R-squared value on chart.”
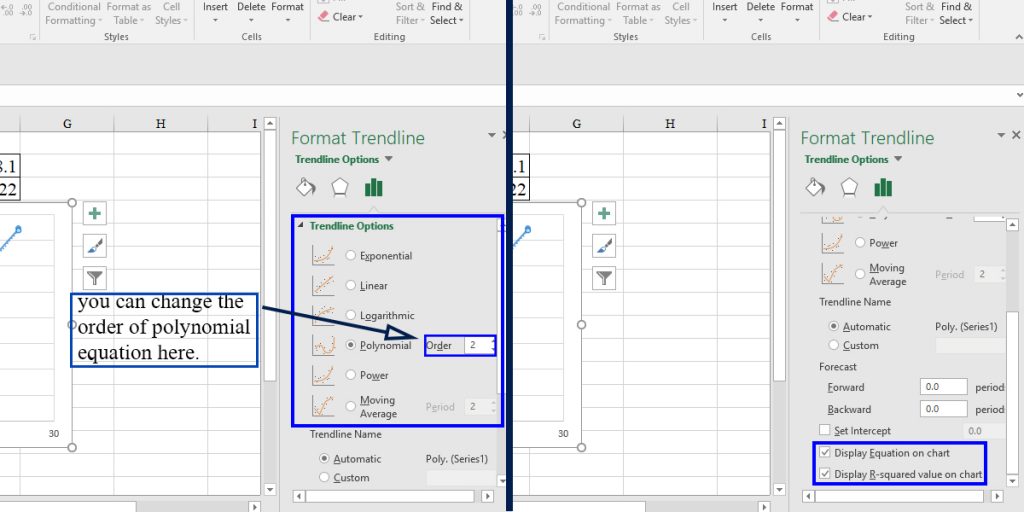
At this step, we should choose the best equation that matches the data. We can understand this using R-squared. The more R-squared, the more the equation matches the data. If the R-squared value is less than 0.9, it is better not to use the equation because it would not be accurate enough.
3. Check display equation on chart
4. Put x in the equation.
GROWTH Function
If the data is exponential, we can use the Excel GROWTH function.
The GROWTH function predicts a value based on exponential regression. It supposes the equation in the form of y = b*m^x
The GROWTH function syntax is as bellows:
GROWTH(known_y’s,[known_x’s],[new_x’s],[const])
known_y’s: The set of known y values
[known_x’s]: The range of cells or arrays of x values
[new_x’s]: The value for which we want to predict corresponding y value
[const]: This is a logical value. 1 means the function will calculate b normally, and 0 means b is supposed to be 1.
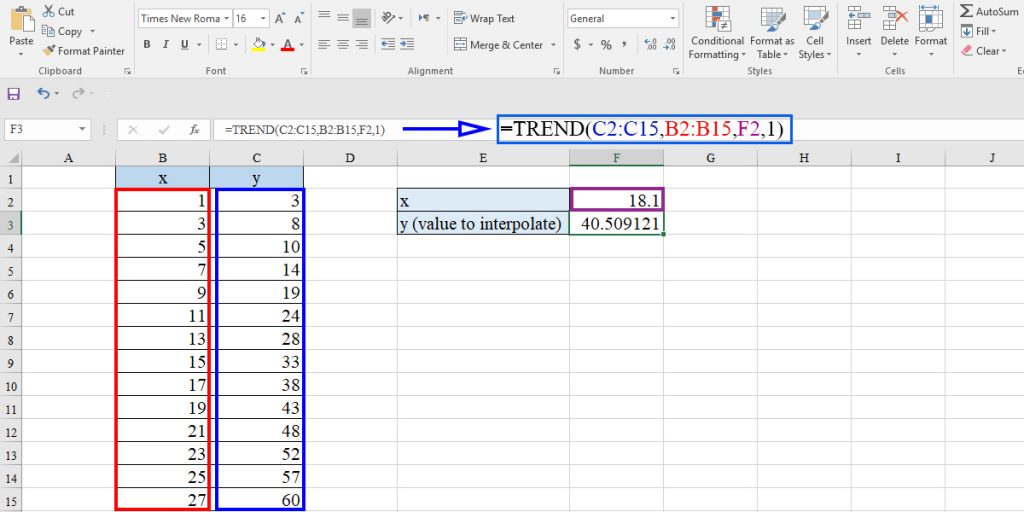
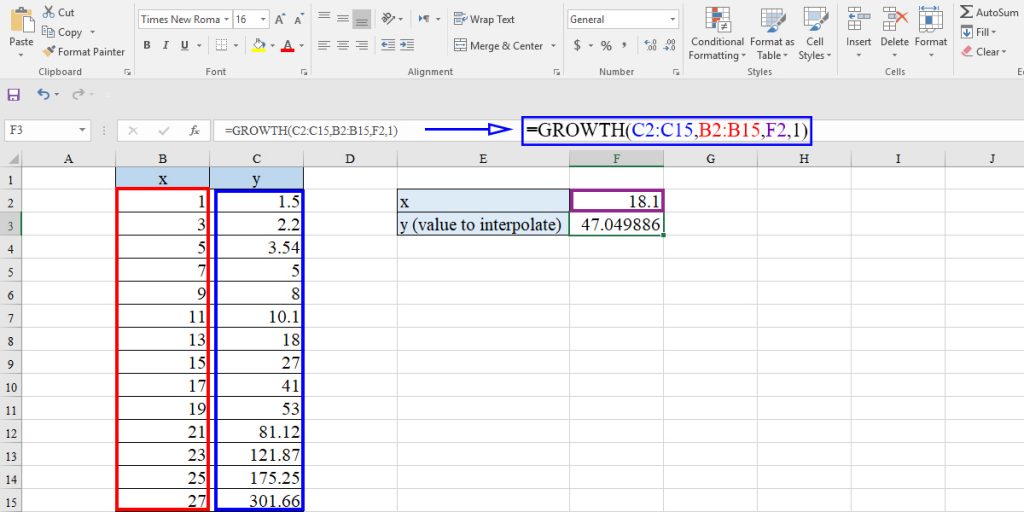
To interpolate using growth function in our example, type the following equation in a cell:
=GROWTH(C2:C15,B2:B15,F2,1)
Enhance your software capabilities with our customizable Add-In Solutions, seamlessly integrating new features to meet your business needs.
Possible Errors
#REF!: This error will occur if the size of the datasets is not equal.
#VALUE!: This error will occur if the data set’s values are non-numeric, or the logical input for the “linear constant” is not correct.
FAQ
Depending on what type of interpolation you need, Excel provides different functions to use. As we discussed in the blog, in the case of linear interpolation, you can use the FORECAST function or TREND function. When your data behaviour is exponential, the GROWTH function is useful.
Regression is the process to find the line or curve that best fits the dataset. After you find the line, you can calculate the missing value using the line’s (or curve) equation. This second process is an interpolation.
When you predict a value in the range of your dataset, you are interpolating, while extrapolation is used when you want to predict a value beyond your dataset.
During extrapolation, our aim is to estimate a value outside the range of data. To do this, we assume that data continues its trend, and this might not be true. But in interpolation, we want to calculate an unknown value within the range of data.
So we can state that the value calculated from interpolation is more valid than the one calculated from extrapolation.
Sum Up
Every time you need to interpolate, the first thing you have to do is to check the data’s behavior. If it’s linear, you can interpolate using one of the four methods we introduced. If they’re not linear, you can interpolate using one of the two methods we introduced for nonlinear interpolation.
You can connect with us and ask our experts for your inquiries and get more Excel Support Service.Reduce cost, accelerate tasks, and improve quality with Excel Automation Service.
Our experts will be glad to help you, If this article didn’t answer your questions. ASK NOW
We believe this content can enhance our services. Yet, it’s awaiting comprehensive review. Your suggestions for improvement are invaluable. Kindly report any issue or suggestion using the “Report an issue” button below. We value your input.


This is really helpful, keep it up!