Forecasting in Excel: Everything You Should Know
For businesses of all sizes, the ability to predict future trends and demands is crucial. This is where forecasting in Excel comes in. Forecasting is all about predicting future trends based on past data.
When you use the Forecast Function in Excel, you’re making educated guesses and employing a data-driven approach to make more accurate predictions. Excel forecasting tools like moving averages, exponential smoothing, and more allow you to make informed decisions backed by numbers and data.
In this comprehensive guide, we’ll delve into Forecasting Techniques in Excel. By reading this post you’ll get the knowledge and techniques needed to navigate this complex terrain with confidence.
Why Forecasting in Excel Matters
Accurate forecasting has a significant impact on businesses. Imagine being able to anticipate customer demand, optimize inventory levels, and manage resources effectively. Forecasting empowers you to:
- Make informed decisions: Plan for future needs, allocate resources strategically, and mitigate potential risks.
- Improve financial health: Reduce costs associated with overstocking or understocking, and streamline cash flow management.
- Enhance customer satisfaction: Ensure you have enough inventory to meet customer needs and avoid stockouts.
Forecasting is one of the top uses of Microsoft Excel in Business. It empowers businesses to be proactive and data-driven in their decision-making. It allows them to anticipate future challenges and opportunities. This leads to improved efficiency, profitability, and customer satisfaction.
Wondering how to forecast in Excel? Here are plenty of tutorials and guides available to help you. Keep reading.
Basics of Forecasting in Excel
When you understand how to forecast in Excel, you are well on your way to success. Excel is straightforward, affordable, and effective. Even inexperienced project managers can use Excel for project management and basic forecasting.
Excel offers a user-friendly “Forecast Sheet” feature. You simply select your data range and choose the desired forecast type (linear, exponential, etc.). Excel automatically generates a forecast chart and table.
This method leverages Excel’s built-in Data Analysis tool to calculate moving averages. This makes it a cost-effective tool for basic forecasting. Keep reading to learn the step-by-step guide to build a basic forecast in Excel.
How to Create a Basic Forcast in Excel
Excel comes with a special tool called the Forecast Function. This function takes your old data and predicts future trends. Imagine knowing your sales for next month today. That’s the power of the Forecast Function in Excel.
Here is a step-by-step guide to making a forecast in Excel. It’s so simple!
1. Prepare Your Data:
- Enter two corresponding data series in a worksheet:
- A series with dates/times for the timeline (consistent intervals are crucial).
- A series with corresponding values you want to predict for future dates.
Note: Summarizing data beforehand can improve forecast accuracy. However, the forecast is still accurate if the timeline has up to 30% missing data points or duplicate timestamps.
2. Select Both Data Series:
Select a cell in one series and Excel automatically selects the rest.
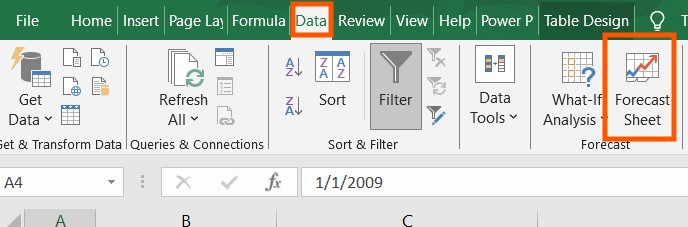
3. Navigate to the Forecast Tool:
- Go to the Data tab.
- In the Forecast group, click Forecast Sheet.
4. Create the Forecast Worksheet:
- Choose a line or column chart for the forecast visualization in the Create Forecast Worksheet box.
- Select the desired end date in the Forecast End box.
- Click Create.
Excel creates a new worksheet containing the table and chart, located to the left of your original data sheet. It is the simplest method of creating a forecast in Excel.
This step-by-step forecast provides valuable insights, but you may want to understand the nitty-gritty of the forecast calculation. Or you want to explore other forecasting techniques in Excel and find customization options. In the following section, we’ll explain more techniques.
Common Forecasting Techniques in Excel
Excel provides several forecasting techniques, each suited to different scenarios. For example, the moving average approach can be used to make basic forecasts. Here’s a look at two of the most popular Excel forecasting techniques:
1. Moving Average (AVERAGE)
Excel Moving Average Forecast is a simple technique used to smooth out fluctuations in data and identify underlying trends. It is suitable for short-term forecasts with relatively stable trends. You can use this method for sales forecasting in Excel.
Here you can learn how to implement moving averages in Excel with a step-by-step guide on manually using the AVERAGE function. We’ll be creating a two-month moving average, but you can easily adjust this process for any desired interval.
- Prepare Your Data:
- Ensure your data is organized in a single column with labels (optional) in the first row.
- Create a new column next to your data to house the moving average values.
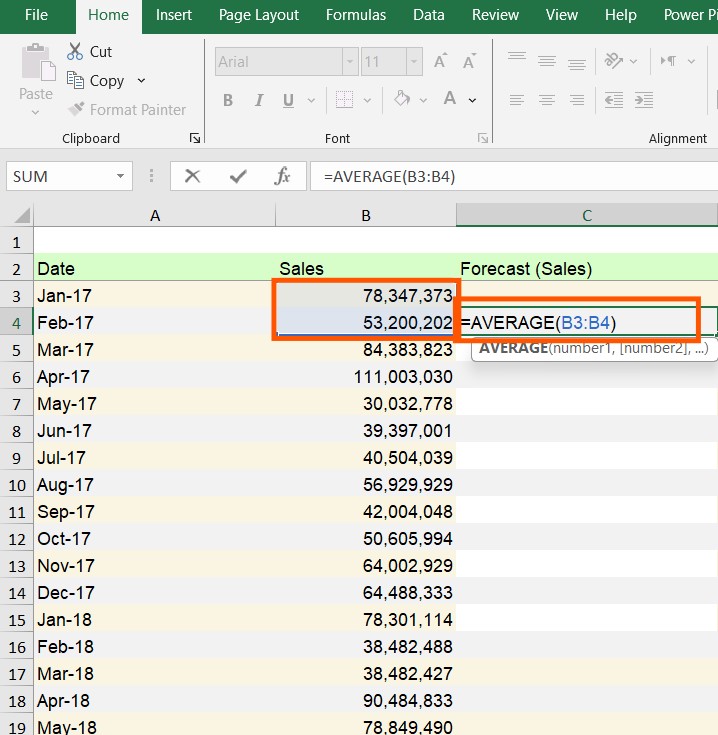
- Calculate the First Moving Average:
- Activate a cell in the new column (let’s say cell C4).
- Enter the formula =AVERAGE(B3:B4). This formula calculates the average of the values in cells B3 and B4 (data for the first two months). This references the range of cells containing the data points for the first two months (January and February in this example).
- Apply the Formula to the Rest:
- Click on cell C4 (where the formula is entered).
- Place your cursor on the bottom right corner of the cell until it turns into a small black plus sign (fill handle).
- Drag the fill handle down to the remaining cells in the new column where you want the moving average values.
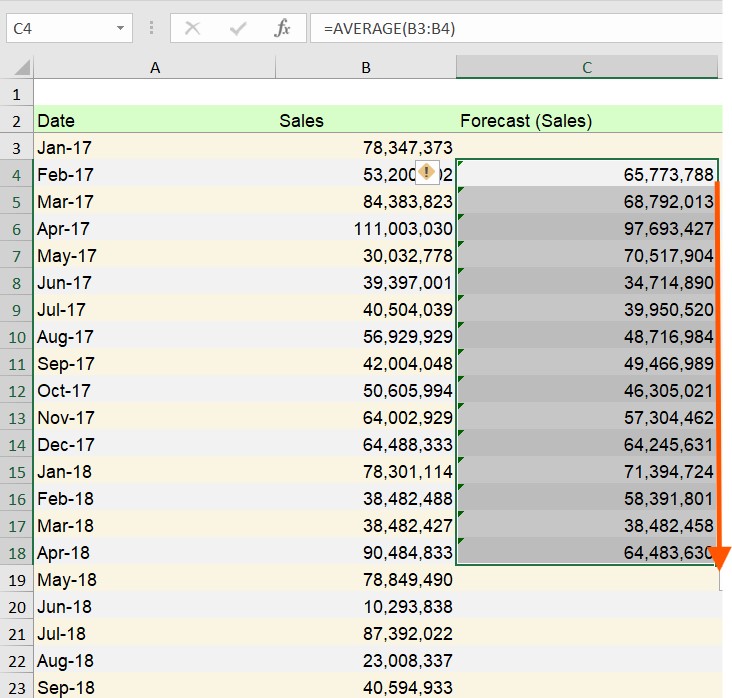
What Just Happened? By dragging the formula down, Excel automatically adjusts the cell references within the formula.
- In cell C5, the formula becomes =AVERAGE(B4:B5). It calculates the average for the second and third months (February and March).
- This pattern continues as you drag the formula down. It provides the moving average for each subsequent two-month period in your data.
- Visualize the Trend:
- Highlight both your data column and the moving average column.
- Go to the “Insert” tab.
- Click on the desired chart type (e.g., Line Chart).
Note: Here, a Line Chart is the most suitable choice. Line charts excel at displaying trends over time, making them ideal for visualizing moving averages. Unlike a pie chart, which represents static proportions, line charts effectively depict the “movement” of the data points and the moving average line.
Now you can click on the table to activate it and customize the line style, color, and other visual elements.
Pro Tip: There is an alternative method that may work in most Excel versions. In this method, you can add a Moving Average Trendline using your data.
- Activate the Chart: Click anywhere on the chart to make it the active object.
- Find the Trendline Option: Look for a small “+” symbol in the top right corner of the chart area. Click on it. This opens a list of options.
- In the “Add Chart Elements” group, click on “Trendline.”
Note: Data Analysis ToolPak method requires activating the Data Analysis ToolPak add-in (refer to Microsoft’s documentation for activation steps if not already enabled).
There may be other methods to do moving averages in Excel. You can contact our consultants to learn more about them. Our team can help you find the best moving average period for your specific needs. Contact Us Today!
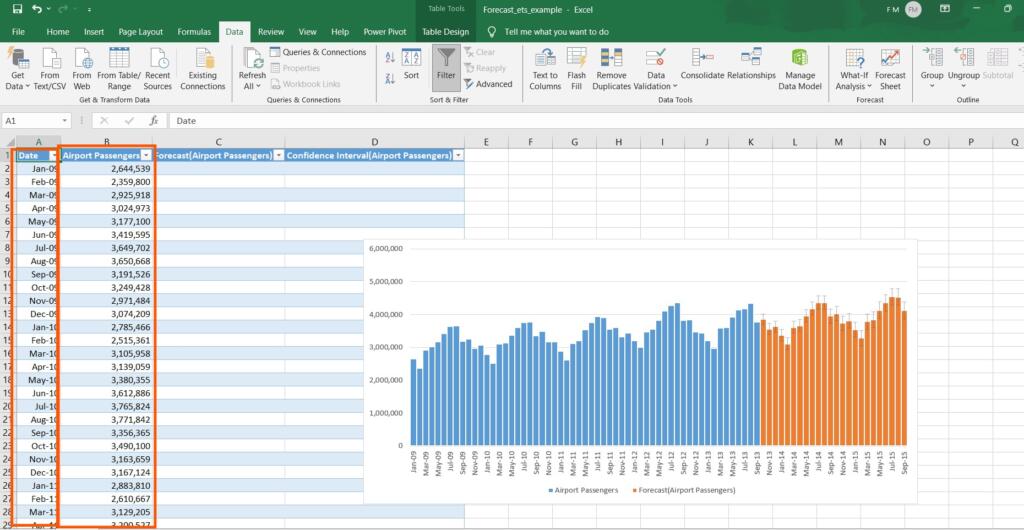
2. Exponential Smoothing (FORECAST.ETS)
Exponential Smoothing assigns greater weight to recent data points than older ones. This makes it ideal for capturing recent trends and seasonality. It’s a more sophisticated approach than moving averages.
Here’s a step-by-step guide using your sample data:
- Select Your Data:
- Highlight the cells containing your data series. Excel is smart enough to recognize the range automatically if you click on any cell within the data set.
Pro Tip: For accurate forecasting with Exponential Smoothing, ensure your data meets these criteria:
- Two Series: You should have two data series, typically a time series (e.g., months) and the corresponding numeric values for each time period (e.g., sales figures).
- Equal Intervals: Your time series should have consistent intervals, like monthly, quarterly, or annual values.
- Access the Forecast Tool:
- Go to the “Data” tab on the Excel ribbon.
- Locate the “Forecast” group.
- Click on “Forecast Sheet.”
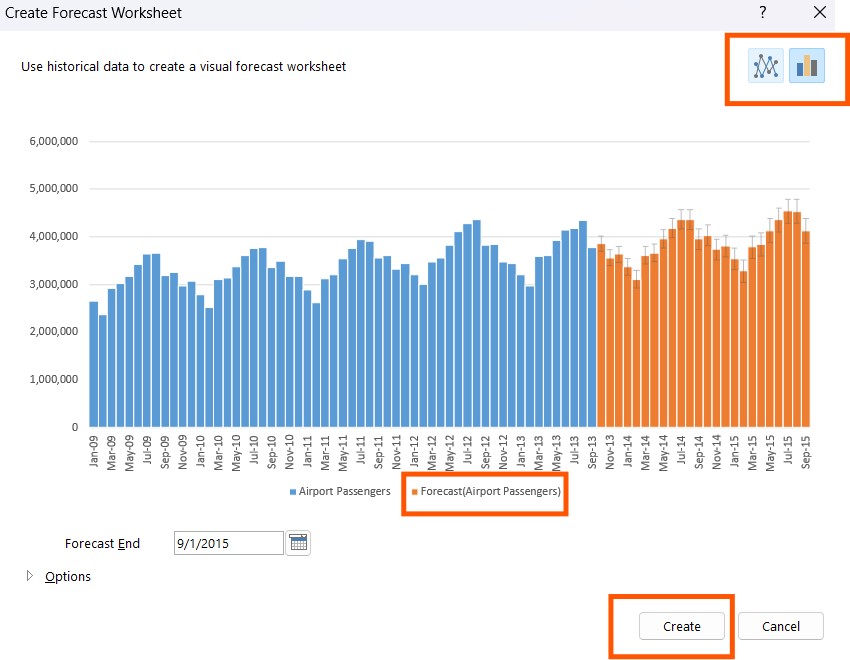
- Customize the Forecast Settings:
The “Create Forecast Sheet” window appears, providing a chart preview and customization options.
a) Chart Type:
In the top right corner, you can choose between a line chart or a bar chart to visualize your forecast. Select the chart type that best suits your needs.
b) Forecast End Date:
Specify the desired timeframe for your forecast. For example, you can predict sales for the next 6 months.
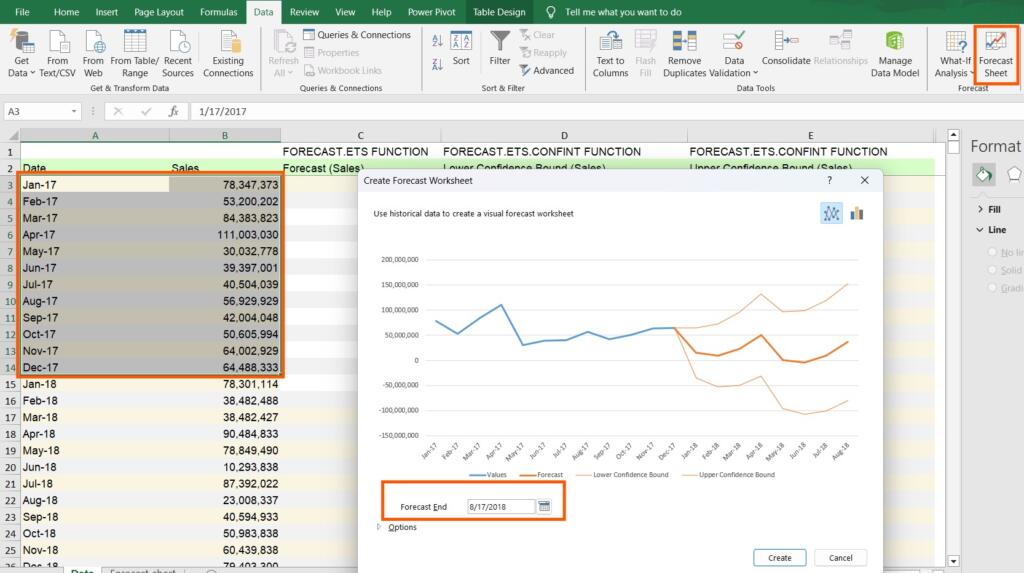
c) Forecast Start Date:
You can adjust the starting point for your forecast. Let’s change it to September 1, 2022. As you modify this date, the orange forecast line in the preview adjusts accordingly.
Pro Tip: While you might have actual sales data, including these months in the forecast allows you to compare the forecasted values with the actual figures. This comparison helps assess the accuracy of the forecast model.
d) Confidence Interval:
The confidence interval reflects the predicted value’s accuracy. A lower confidence interval (e.g., 70% as set in the example) indicates greater confidence in your forecast.
e) Additional Options:
Explore other customization options available in the window, such as adjusting data ranges or modifying the smoothing factor (alpha) if needed.
- Generate the Forecast:
Once you’ve set your desired parameters, click the “Create” button.
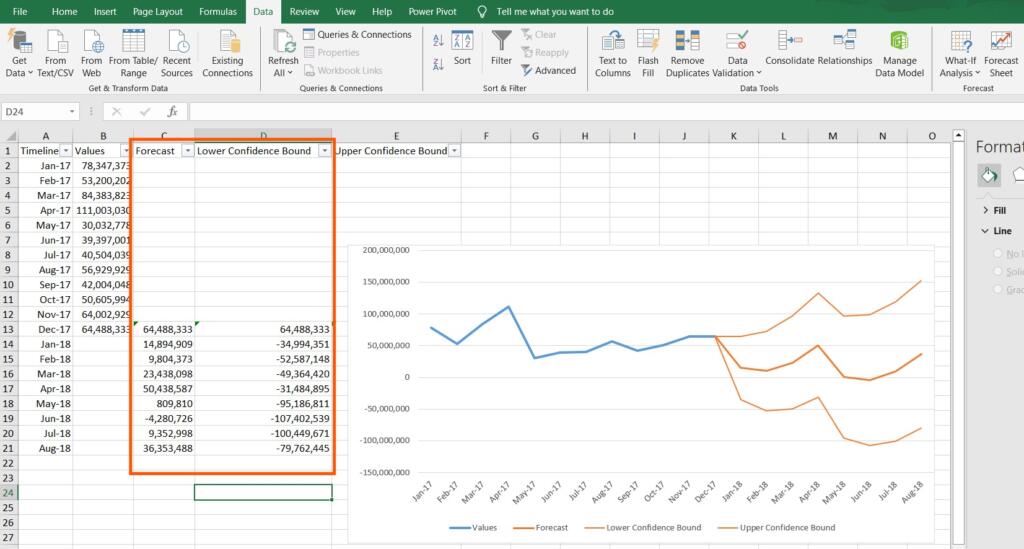
- Interpreting the Results:
Excel creates a new “Forecast Sheet” containing the following information:
- Sales Forecasts: This section displays the forecasted sales values for the specified months.
- Confidence Intervals: This section shows the upper and lower confidence limits for the forecasted values.
By analyzing these results, you gain valuable insights into potential future trends and their associated level of certainty.
But if your data is complex, we have step-by-step tutorials to help you set up exponential models. We also provide custom Excel templates that make seasonal forecasting a breeze. For more information contact our experts.
If you want to use advanced Excel features, there are also advanced forecasting methods that we will explain in the next section. Keep reading.
Advanced Forecasting Methods in Excel
For more complex scenarios, Excel offers advanced forecasting techniques. Regression Analysis establishes a mathematical relationship between independent and dependent variables. You can demonstrate regression in Excel for predictive modeling based on changes in the independent variables.
3. Linear Regression (TREND)
This function creates a linear trendline that best fits your data. It allows you to project future values based on the established linear relationship. It is applicable when your data exhibits a clear linear trend. Regression Analysis is useful for exploring potential outcomes based on different market conditions or business strategies.
Linear regression is a popular forecasting technique that assumes a linear relationship between your historical data points. Here’s how to use the FORECAST.LINEAR function in Excel to create a forecast:
- Prepare Your Data:
- Ensure your data is organized in two columns:
- The first column should contain your time series (e.g., dates).
- The second column should contain the corresponding numeric values you want to forecast (e.g., sales figures).
- Identify the Forecast Start Date:
- Determine the first date for which you want to predict a value. This will be the starting point of your forecast.
- Apply the FORECAST.LINEAR Function:
In a new cell (where you want the first forecasted value to appear), enter the formula:
Excel
=FORECAST.LINEAR(target_date, known_x_values, known_y_values)
- Replace the placeholders:
- target_date: Enter the cell reference containing the forecast start date you identified in step 2.
- known_x_values: Enter the cell range containing your historical data values (e.g., sales figures). Use absolute cell references (e.g., B51:B59) to maintain the range when copying the formula.
- known_y_values: Enter the cell range containing your time series data (e.g., dates). Use absolute cell references (e.g., A51:A59) for the same reason.
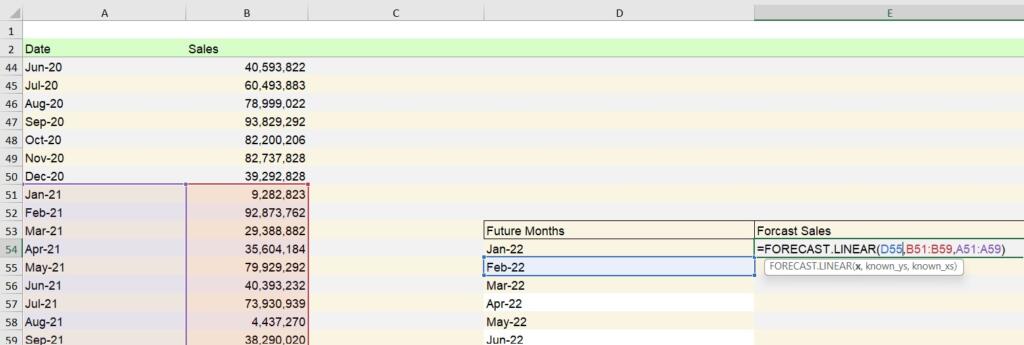
Example:
Let’s say your forecast start date is in cell D55 (January 1, 2022), your sales data is in B51:B59, and your time series is in A51:A59. The complete formula would be:
=FORECAST.LINEAR(D55, B51:B59, A51:A59)
- Press Enter. This will display the forecasted sales value for January 1, 2022.
- Copy and Paste the Formula:
- Click on the cell containing the formula (e.g., the cell where you see the forecasted value for January 1, 2022).
- Place your cursor on the bottom right corner of the cell until it turns into a small black plus sign (fill handle).
- Drag the fill handle down to the remaining cells where you want the forecasted values for subsequent months.
- Visualizing the Results (Optional):
- Select all your data, including the actual sales data, time series data, and forecasted sales values.
- Go to the “Insert” tab.
- Click on “Recommended Charts” or browse through the available chart types (e.g., Line Chart).
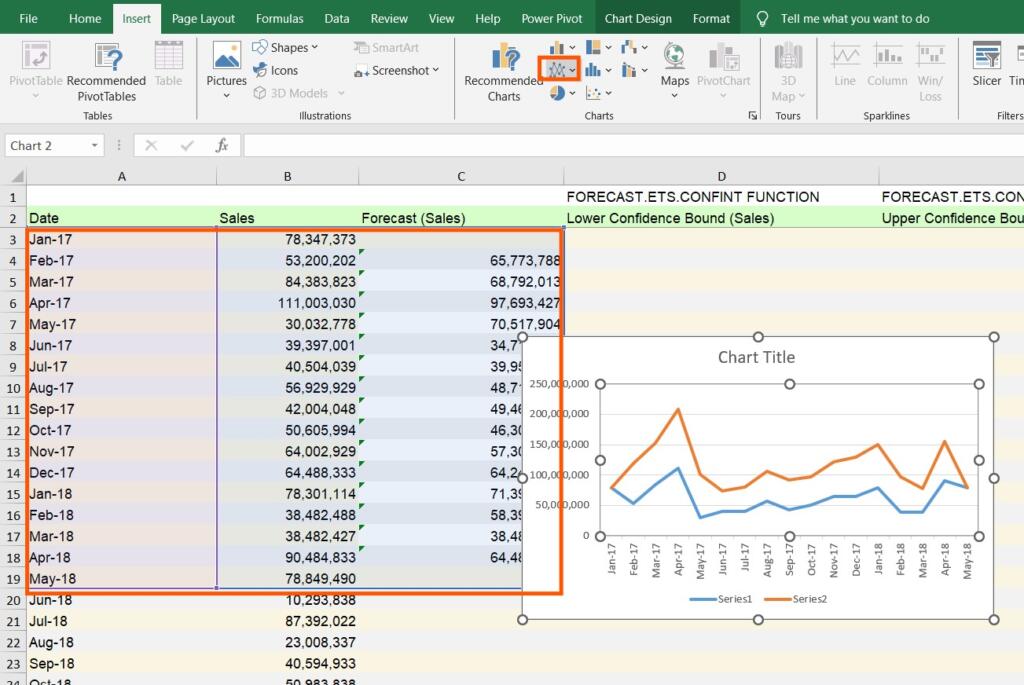
Understanding the Chart:
Excel will generate a line chart depicting the following:
- Actual Sales: Represented by data points (often blue).
- Forecast Sales: Represented by a separate line (often orange) extending beyond the actual sales data points.
- Linear Trendline: Excel might automatically add a trendline to the forecast sales line. This line represents the linear relationship identified by the regression analysis.
If you’re having trouble using these methods, there’s a simple way to get started with basic forecasting in Excel that doesn’t require sophisticated calculations. Continue reading to learn about the Time Series Analysis Method in Excel.
4. Time Series Analysis
Excel Data Analysis for forecasting helps you analyze time-based data to identify patterns and seasonality over time. Here’s a breakdown of the steps:
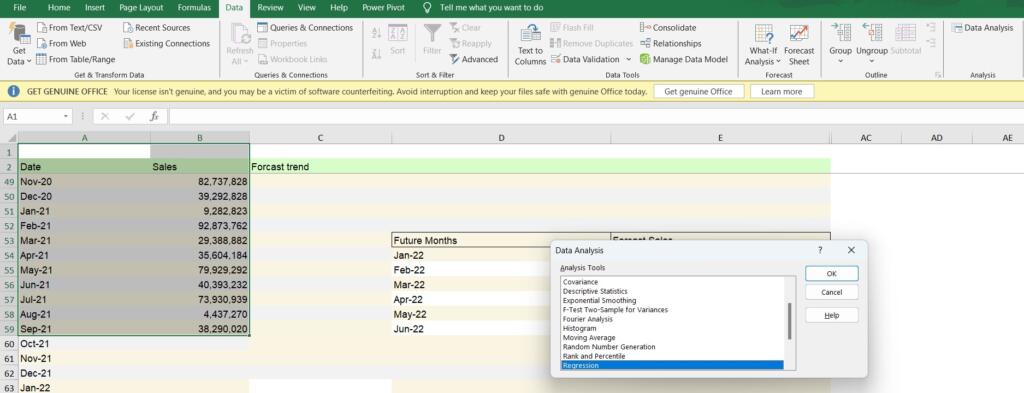
- Access the Data Analysis Tool:
- Go to the “Data” tab.
- Click on “Analysis” in the ribbon.
- Select “Data Analysis” from the dropdown menu.
- Pro Tip! If you can’t find “Data Analysis,” activate it by going to “File” > “Options” > “Add-Ins.” Find “Analysis ToolPak” and check the box before clicking “OK.”
- Choose Moving Averages: The “Data Analysis” window appears. Select “Moving Averages” from the list of analysis tools.
- Set Up the Moving Averages Calculation:
- Input Range: Specify the cell range containing your sales data.
- Interval: Enter the desired moving average window size (e.g., 2 for a two-month moving average).
- Output Range: Choose a cell range where you want the calculated moving averages to be displayed.
- Calculate and View Results: Click “OK” to execute the calculations. The moving averages will be displayed in the specified output range.
Note: You might see “N/A” for the first few data points because calculating a moving average requires a minimum number of data points equal to the window size. - Visualize Moving Averages (Optional):
- Select the data set (including months and sales figures).
- Go to the “Insert” tab.
- Click on “Charts” and choose a desired line chart type (e.g., 2D Line Chart). This generates a chart displaying both your sales data and a single trendline.
As you see while basic forecasting is easy, advanced features can be confusing. The more complex your needs, the steeper the learning curve.
At Bsuite365, we provide personalized training sessions and easy-to-follow guides on Excel forecasting. We make even the most complex functions easy to understand. Contact our consultants Today.
Choosing the Right Forecasting Models In Excel
You should care about choosing the right forecasting models in Excel. Choosing the right model isn’t just about accuracy; it’s about making better decisions for your business. The better the model, the more confident you can be in your planning.
The model you select affects how accurate your forecasts will be. It’s like choosing the right tool for a job. A good match helps you get the work done more efficiently.
Different Models for Different Needs:
- Linear Model: Ideal for straightforward trends with a constant increase or decrease. This is your go-to model when your data follows a clear, straight line.
- Exponential Model: Effective for data exhibiting non-linear growth or decline. Use this model when your data shows a consistent pattern of accelerating or decelerating change.
- Seasonal Model: Designed for data with recurring patterns, like seasonal sales fluctuations. This model is perfect for capturing predictable ups and downs throughout the year.
- Moving Average Model: Useful for smoothing out short-term fluctuations and highlighting long-term trends. This model helps you see the bigger picture by filtering out temporary bumps and dips.
- Regression Model: This powerful tool goes beyond simple trendlines, allowing you to identify relationships between multiple variables that can influence your forecasts.
- Data Analysis Tool: Excel’s built-in Data Analysis tool offers functionalities like moving averages calculations, and simplifying specific forecasting tasks.
Excel brings a lot of flexibility and customization to the table, making it a go-to tool for forecasting. But it does have its challenges, like limited real-time collaboration and the need for manual saving. Still, for many of you, the pros will outweigh the cons.
If you’re working with missing or uneven data points before applying a forecasting method, you may need to fill those gaps first. Learn how to do that step-by-step in our guide on how to interpolate in Excel.
Wondering how to make the choice? Think about your goals. Do you want to plan for the next month, the next quarter, or the next year? We can help you match your goals to the best Excel forecasting model. You can even create a 12 Month Sales Forecast Excel Template tailored to your needs.
We offer integration services that combine Excel with real-time collaboration tools like Microsoft Teams. Your team can edit the same Excel sheet simultaneously.
Conclusion
As you can see, you don’t have to be a math genius to use Excel for forecasting. The interface is user-friendly. All the steps are simple to follow. If you’re wondering how to forecast in Excel, many online tutorials can guide you.
Excel helps you make quick but informed decisions. The Forecast Function in Excel gives you insights fast. This means you can adapt your strategies in real-time.
Imagine knowing today how much you’ll sell next month or even next year. Sounds amazing, right? Sales forecasting in Excel is your ticket to smarter planning and less stress.
If you have questions you can ask in the following box. Or contact our Excel experts. We can import your past sales data into Excel, making it easy for you to start forecasting.
FAQs
Here are answers to some frequently asked questions about using Excel for forecasting:
Q1. What are the key Excel functions for basic forecasting?
There are three main functions for basic forecasting in Excel:
- Moving Average (AVERAGE function): This function calculates the average of a specific number of data points within a moving window. It helps smooth out fluctuations and reveal underlying trends.
- Exponential Smoothing (FORECAST.ETS function): This function assigns more weight to recent data points, capturing trends and seasonality more effectively. It’s ideal for data with changing patterns.
- Linear Regression (FORECAST.LINEAR function): This function identifies the best-fitting straight line through your data. It’s suitable for forecasting based on an established linear relationship.
Q2. What are the advantages of using moving averages for forecasting in Excel?
Moving averages offer several advantages:
- Simplicity: Easy to understand and implement using the AVERAGE function.
- Trend Identification: Smooths out fluctuations, making underlying trends clearer.
Q3. Can Excel handle more advanced forecasting methods like regression analysis?
Yes, Excel can handle regression analysis using FORECAST.LINEAR function. Read the Linear Regression section of this article for a step-by-step guide.
Q4. Are there any common pitfalls to avoid in Excel forecasting?
Here are some common pitfalls to avoid:
- Using inaccurate or incomplete data: Garbage in, garbage out! Ensure your data is accurate and reflects the entire relevant timeframe.
- Choosing the wrong forecasting method: Different methods suit different data patterns. Understand the strengths and weaknesses of each technique before applying it.
- Overreliance on a single forecast: Consider using multiple forecasting methods and compare the results for a more comprehensive picture.
Q5. How can I use Excel for financial forecasting and budget planning?
Using Excel, you can forecast sales with Moving Average and Linear Regression models. For specialized help with “Excel Financial Forecasting Tutorial”, “Budgeting with Excel”, or “Creating a Financial Model in Excel”, contact our consultants.
Q6. Can Excel be used for scenario analysis in forecasting?
Yes, Excel’s scenario manager allows you to create different forecasting scenarios based on varying assumptions. You can use formulas within each scenario to model different outcomes.
Q7. Where can I find Excel Forecasting Templates or tools to simplify forecasting in Excel?
Microsoft provides Excel templates for various forecasting needs, such as time series analysis. You can also find free or paid forecasting add-ins for Excel that offer additional functionalities. Our consultants can also provide assistance.
Q8. How often should I update my Excel forecasts?
The frequency of updating your forecasts depends on the volatility of your data. For data with rapid changes, you might need to update more frequently. Generally, it’s good practice to review and potentially revise your forecasts regularly as you acquire new data.
Q9. Can Excel forecasting be integrated with other business intelligence tools?
Yes, Excel data can be exported and integrated with other business intelligence (BI) tools for more sophisticated analysis and visualization.
Q10. How To Forecast Sales In Excel?
You’ll first need to gather your past sales data to forecast sales in Excel. Then, you can use Excel’s Forecast Function to generate future sales figures. It’s a handy tool for planning and budgeting. Re-read this post to learn different forecasting techniques.
Q11. How Accurate Is Excel’s Forecast Function?
Excel’s Forecast Function is generally quite reliable for basic forecasting needs. However, Excel forecast accuracy largely depends on the quality of your historical data and how well the data fits the chosen forecasting model.
Q12. How to Forecast in Excel Based on Historical Data?
You can easily forecast in Excel using historical data by selecting your past data and then applying Excel’s built-in Forecast Function. This helps you predict future numbers based on past trends.
Q13. Can Excel Do Future Value?
Yes, Excel can calculate future value using the “FV” function. This is useful for things like investment planning and savings goals.
Q14. What Is the Formula for Forecasting?
In Excel, the basic formula for forecasting using linear regression is =FORECAST(x, known_y’s, known_x’s). Here, “x” is the point you want to forecast, and “known_y’s” and “known_x’s” are your historical data.
Our experts will be glad to help you, If this article didn’t answer your questions. ASK NOW
We believe this content can enhance our services. Yet, it’s awaiting comprehensive review. Your suggestions for improvement are invaluable. Kindly report any issue or suggestion using the “Report an issue” button below. We value your input.
About the Author: Fahimeh N
document.getElementById(“review-notice”).remove();
document.getElementsByTagName(“hide-notice”)[0].parentNode.remove();
}


