Advanced Excel Features for Data Analysis
Excel is an inseparable part of any business in today’s world, and you can barely find a tech-based company not using Excel on a regular basis. This versatile tool not only satisfies you with your basic, daily data manipulation but also performs significantly in advanced data analysis. Advanced Excel features for business insights are so powerful that they can compete with modern data analysis tools. In this blog post, we’ll focus on business insight with Excel and introduce the most practical Excel features that can assist you in this regard. Stay with us till the bottom line, and see how you can use advanced Excel features for business insights.
I. PivotTables and PivotCharts Mastery
PivotTables can be considered the core of data analysis in Excel. You can reorganize, sort, count, total, or average data using a PivotTable. It allows you to extract your desired piece of data from large, detailed datasets and reorient it based on your specific queries.
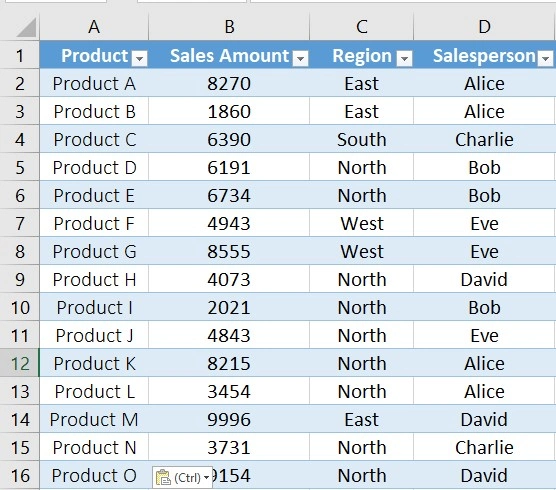
You can drag and drop fields into different parts of the PivotTable and view and compare different summaries of your data. This makes PivotTable an indispensable tool for business insights with Excel. To create a PivotTable out of your dataset, you first need to convert your plain data to a table.
- Select the data range.
- Navigate to the Insert tab and click on the Table option.
Now, you can create a PivotTable through this path:
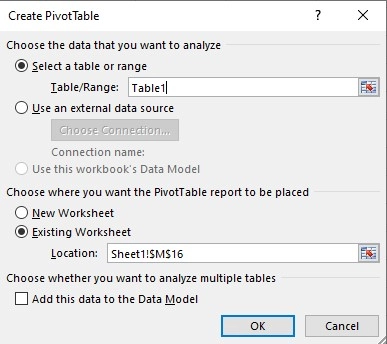
- Go to the Insert tab and click on PivotTable.
- In the Create Table dialog box, specify the data range, check the other options based on your needs, and click OK.
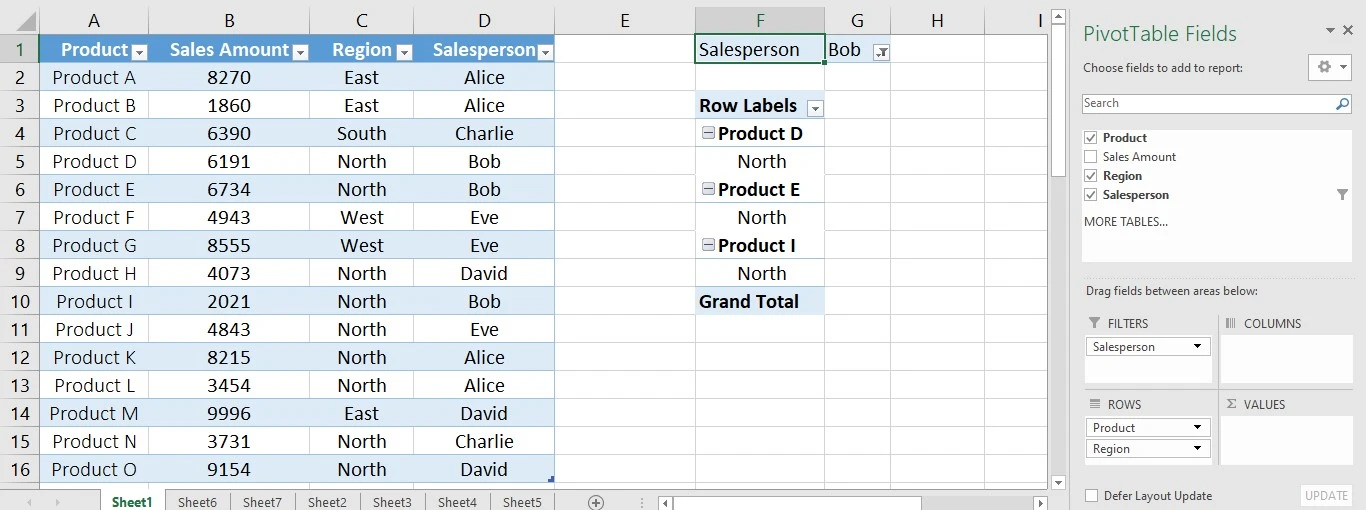
Now, you have access to a PivotTable Field List, where you can choose your desired fields and create customized reports or overviews of your data.
A. Advanced techniques for PivotTable analysis
While basic PivotTables are powerful, advanced techniques can provide you with a deeper level of insight:
Calculated fields: Calculated fields, one of the advanced Excel features for business insights, are custom formulas that allow you to analyze data that isn’t explicitly present in your dataset. When you activate the PivotTable, two new tabs (Analyze and Design) will be displayed on your Excel ribbon.
- Go to the Analyze tab > Fields, Items & Sets dropdown > Calculated Field.
- In the dialog box, you can use any of the fields in your PivotTable and include any of the standard Excel functions.
- Once you’ve created a Calculated Field, it becomes part of your PivotTable field list, and you can use it like any other field.
Slicers: Slicers are visual filters or interactive buttons that allow you to filter the data in a PivotTable easily. To use a slicer, Go to the Analyze tab > Filter group > Insert Slicer. In the dialog box, check the box for each field you want to create a Slicer for, and then click OK.
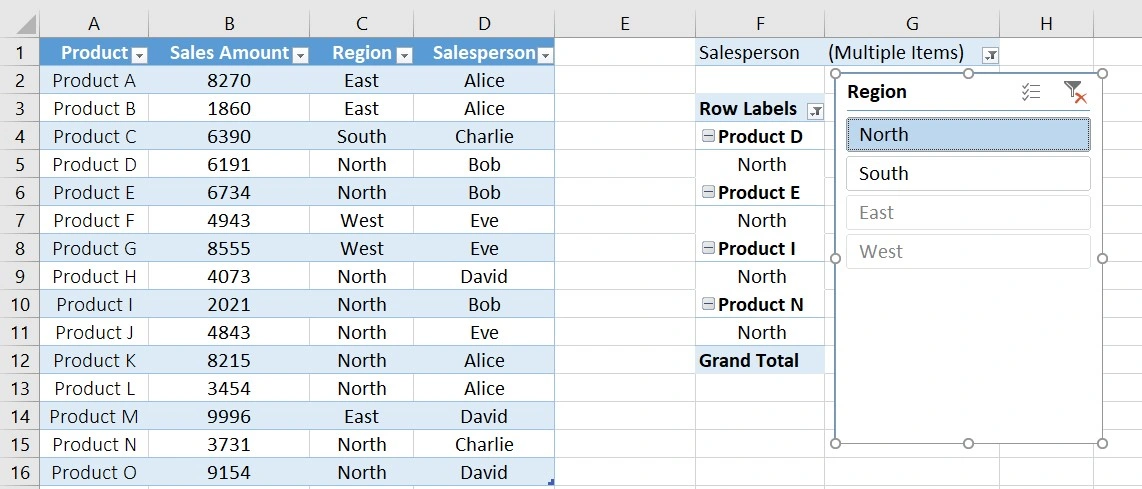
You can click on the buttons to filter your PivotTable data based on a specific value.
Timelines: Timelines are similar to Slicers but are specifically designed for filtering date fields, allowing you to easily filter your data by year, quarter, month, or even day.
- To use a timeline, go to the Analyze tab > Filter group > Insert Timeline.
- Click on the “Insert Timeline” button.
- In the Insert Timelines dialog box, check the box for each date field you want to create a Timeline for, and then click OK.
- Once the Timeline is created, you can customize it based on your needs and adjust it only to cover your desired time.
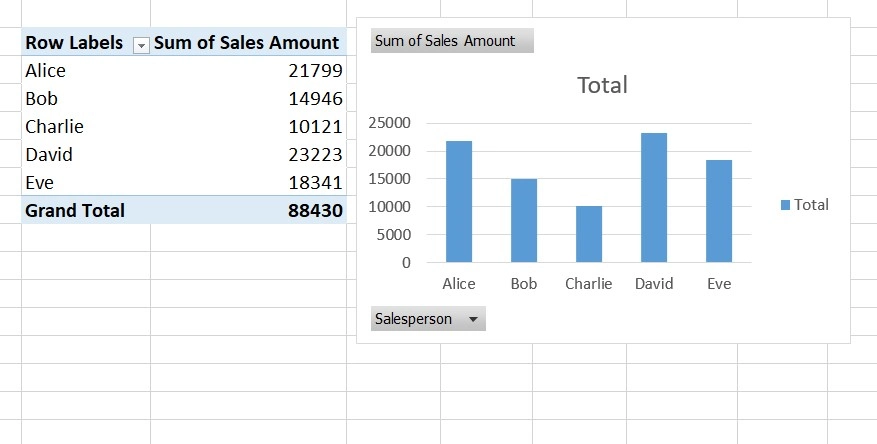
B. Creating dynamic PivotCharts for visual representation
PivotCharts can make the interpretation of data more impactful through visualization. A PivotChart is directly connected to a PivotTable, and any changes you make to the PivotTable are immediately reflected in the PivotChart. It enables you to break down complex data and present your findings in an understandable manner. This is particularly powerful in decision-making with Excel, where structured data can lead to more informed decisions.
To create a PivotChart, go to Analyze tab > Tools > and click PivotChart. You can select any type of chart you prefer and visualize your data easily.
II. Data Validation and Accuracy
Data validation is one of the advanced Excel features for business insights that allows you to control the type of data users enter into a cell. One of the simplest forms of data validation is creating dropdown lists, where users can only choose from a predefined list of values. This is particularly useful when you need to categorize data and want to ensure consistency in the entries.
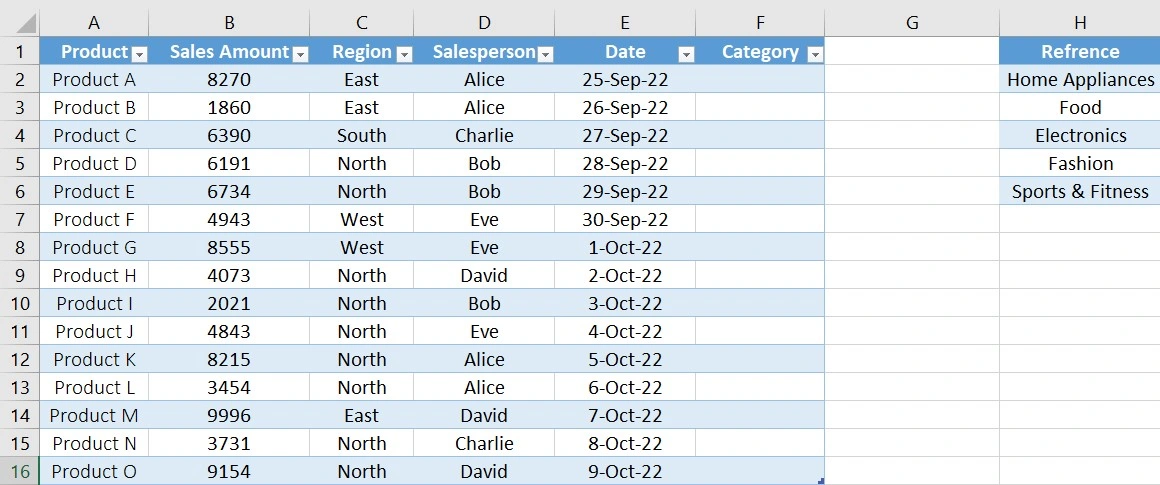
Having the previous data table, let’s say you want to set a dropdown list for product categories. You first need to add the list of categories in a separate column as a reference.
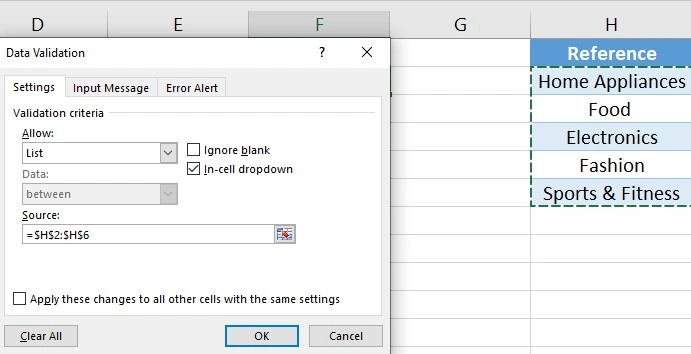
To add a dropdown list, select the first cell of the column
and go to Data > Data Tools > Data Validation. In the dialog box, select “List” from the dropdown menu
and determine the source range.
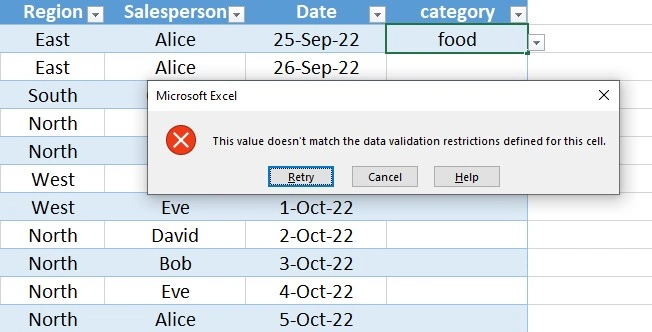
Now, when you click on the cell, you can select an item from a list. It should be noted that if a user tries to type something in these cells, they’ll receive an error.
A. Implementing custom validation rules
Data validation in Excel goes beyond just dropdown lists. In the Data Validation dialog box, you can select the type of data you desire (e.g., decimal, date, time, etc.) from the menu, and users will be allowed only to add that data type.
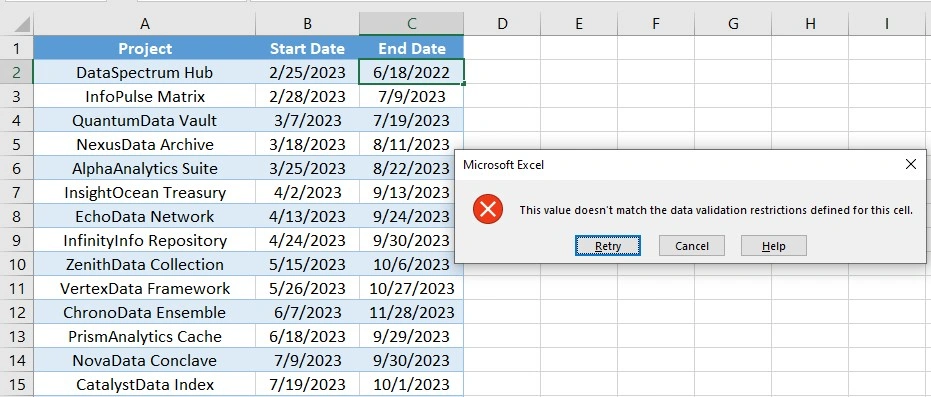
Custom validation rules take data validation a step further. These rules are based on formulas that you define. For instance, you might want to ensure that the date entered in a “Start Date” field is before the date entered in an “End Date” field.
- Click on the first cell in the “End Date” column, and drag to select the range where you want the validation to apply.
- Go to the Data tab > Data Tools > Data Validation.
- Select “Custom” from the “Allow” dropdown menu.
- In the “Formula” box, enter this formula: C2>B2
This formula checks that the date in the “End Date” field (B2) is after the date in the “Start Date” field (A2). If a user inputs an invalid date, this error will pop up:
B. Ensuring Data Consistency for More Reliable Insights
Consistent data is the cornerstone of decision-making with Excel. When your data is consistent and accurate, you can trust the outputs of your analysis, and that can happen through the use of advanced Excel features for business insights.
By setting up rigid validation rules and periodically checking your data for outliers or inconsistencies, you ensure that your dataset remains a reliable source of insights. This can strengthen the foundation of your business strategies, highlighting the role of data validation in business analytics.
III. Power Query for Data Transformation
Among advanced Excel features for business insights, Power Query stands as a formidable tool. This tool simplifies the process of connecting to external data sources and importing data. It not only brings data into Excel but also transforms it into a structure that’s ready for analysis. You can remove unnecessary rows or columns, split columns based on delimiters, and even merge datasets from completely different sources.
A. Advanced Data Cleaning and Shaping Techniques
Power Query performs significantly in advanced data cleaning and shaping. Imagine you’re dealing with a dataset where the date formats are inconsistent or where some entries are misspelled.
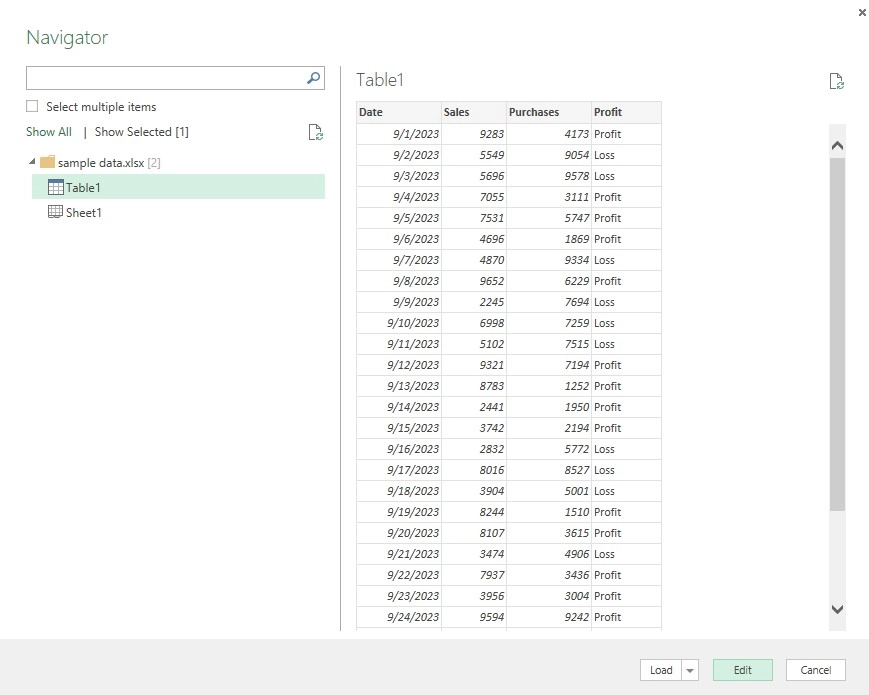
- To access Power Query and correct these issues, go to the Data tab > Get & Transform > New Query and import your data to Excel.
- In the navigator box, click Edit, and the Power Query Editor will open.
Here, you can perform various transformations on your data, like filtering, sorting, merging, etc.
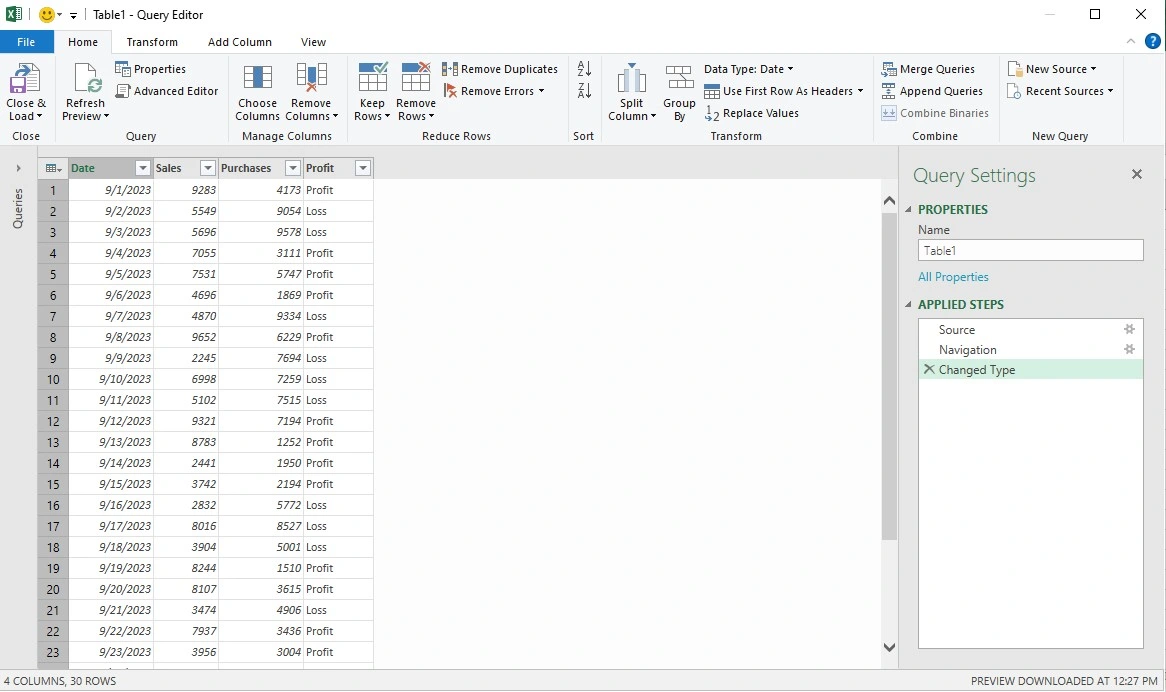
Power Query goes beyond just cleaning data. You can pivot data to transform rows into columns, allowing you to see your data from a different perspective. You can also merge data from multiple sources, creating a comprehensive dataset. These advanced techniques are crucial when conducting strategy analysis using Excel, as they ensure that the data is clean and structured.
B. Merging and Appending Queries for Comprehensive Analysis
Merging and appending queries are two of the most powerful features Power Query offers, enabling analysts to build multi-dimensional datasets. Merging is where two tables are combined based on a shared column. This is invaluable when you need to relate different sets of data to gain a comprehensive understanding of your business operations.
Suppose you have two separate datasets: one containing sales data and another containing product details.
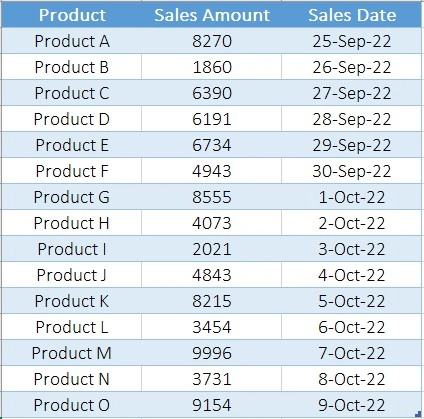
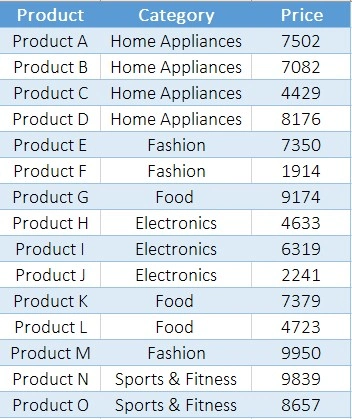
- Load both Datasets into Power Query.
- Use the “Merge Queries” feature, and select “Product” as the common column between the two datasets.
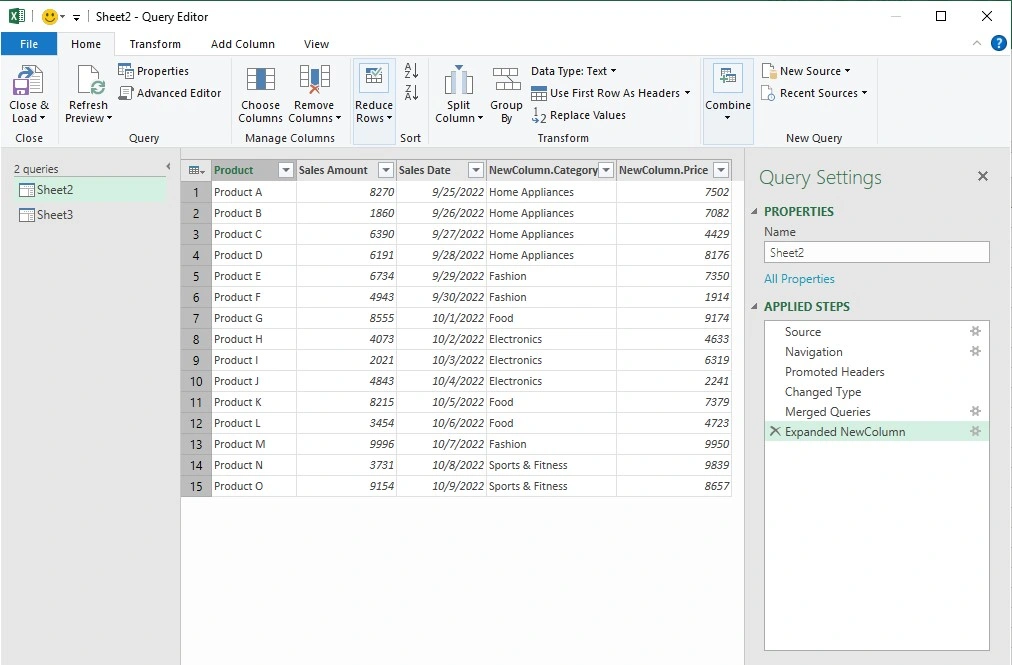
Appending queries, on the other hand, involves stacking data from similar datasets on top of each other, creating a single, unified table. This is particularly useful when dealing with data that are split across multiple files or tables but need to be analyzed as a whole.
You can apply any other changes to this comprehensive dataset based on your needs and load it back into Excel.
IV. Advanced Formulas and Functions
Excel’s vast library of functions can simplify even the most complex calculations, turning exhaustive manual computations into simple processes. Let’s see how to leverage these advanced Excel features for business insights and analyze data with precision.
A. Leveraging Advanced Excel Functions for Complex Calculations
Advanced Excel functions such as VLOOKUP, INDEX, and MATCH are indispensable for searching through and referencing data across your spreadsheets.
For financial analysis, functions like NPV (Net Present Value) and IRR (Internal Rate of Return) are invaluable in evaluating investment opportunities and financial forecasts.
However, the true power of these functions is realized when they are used together to solve complex problems. For instance, combining INDEX and MATCH functions provides a more flexible and powerful lookup compared to VLOOKUP. This flexibility is crucial in strategy analysis using Excel, where the ability to dynamically analyze data can drive smarter business decisions.
B. Nesting Functions and Using Array Formulas for Efficiency
Nesting functions -using one function inside another- is a technique that allows for more complex calculations. For example, you might nest an IF function inside a SUM function to sum only those values that meet certain criteria. This ability reduces errors and enhances the clarity of your analysis.
Array formulas, another advanced Excel feature for business insights, take this efficiency to the next level. They allow you to perform multiple calculations on one or more items in an array, returning either a single result or multiple results. Array formulas are powerful when analyzing datasets with multiple conditions or criteria, enabling a level of data interrogation that is intricate and comprehensive.
C. Dynamic Formulas for Adaptive Data Analysis
Dynamic formulas in Excel are designed to automatically recalculate when new data is added or existing data is modified. This feature is crucial for maintaining the relevance and accuracy of your analysis in a fast-paced business environment. In the context of decision-making with Excel, functions like OFFSET and INDIRECT ensure that your analysis is always based on the latest data. Whether it’s forecasting sales or tracking project timelines, dynamic formulas provide a real-time view of the data, enabling businesses to make informed decisions.
V. Scenario Manager and Goal Seek
“Scenario Manager” and “Goal Seek” are two advanced Excel features for business insights that turn the spreadsheet into a dynamic environment for strategic planning. These features allow you to explore various what-if scenarios and understand the potential outcomes of different decisions.
A. Using Scenario Manager for What-If Analysis
Scenario Manager in Excel allows you to create and save different sets of data (scenarios) within the same Excel model. This tool is particularly beneficial for strategy analysis using Excel, enabling strategists to assess the potential impacts of various strategies before implementing them.
For instance, in financial modeling, you can create scenarios for best-case, worst-case, and most likely-case outcomes based on varying assumptions about sales growth, cost changes, and other variables.
Assume you have a simple financial model for your business that includes this information:
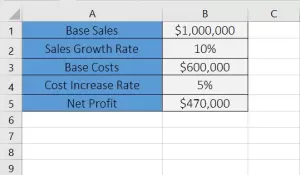
Net Profit is calculated by this formula: =(Base Sales * (1 + Sales Growth Rate)) – (Base Costs * (1 + Cost Increase Rate))
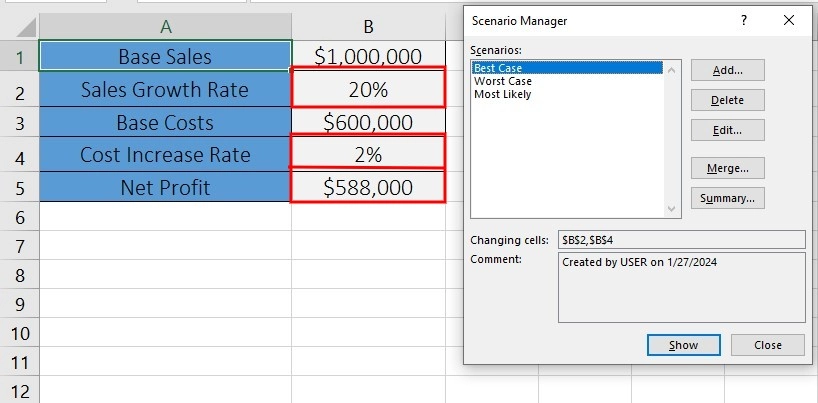
- Best-Case Scenario:
- Sales Growth Rate: 20%
- Cost Increase Rate: 2%
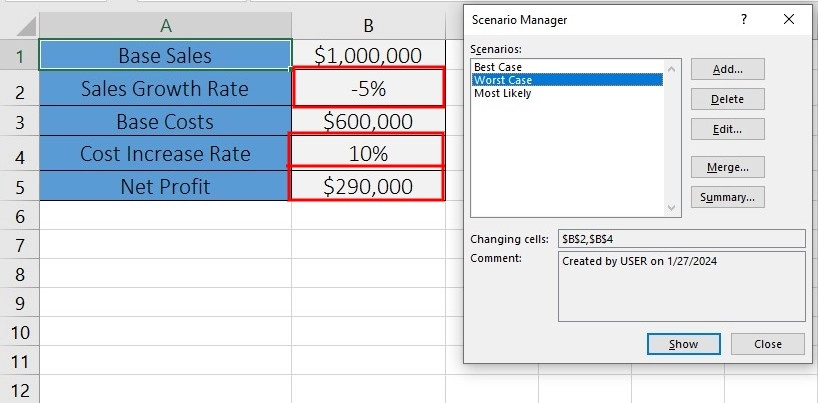
- Worst-Case Scenario:
- Sales Growth Rate: -5%
- Cost Increase Rate: 10%
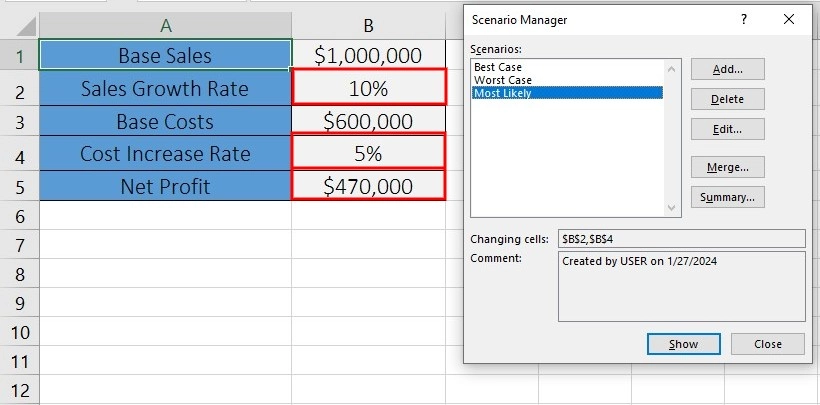
- Most Likely Scenario:
- Sales Growth Rate: 10%
- Cost Increase Rate: 5%
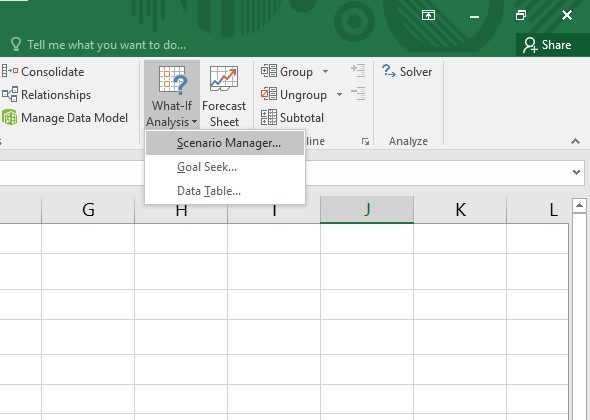
To access Scenario Manager in Excel, go to the Data tab > Forecast > What-If Analysis > Scenario Manager.
- In the Scenario Manager, click “Add” to create a new scenario.
- Define the changing cells (Sales Growth Rate and Cost Increase Rate).
- Input the values for these cells.
- Repeat the process to add all three scenarios.
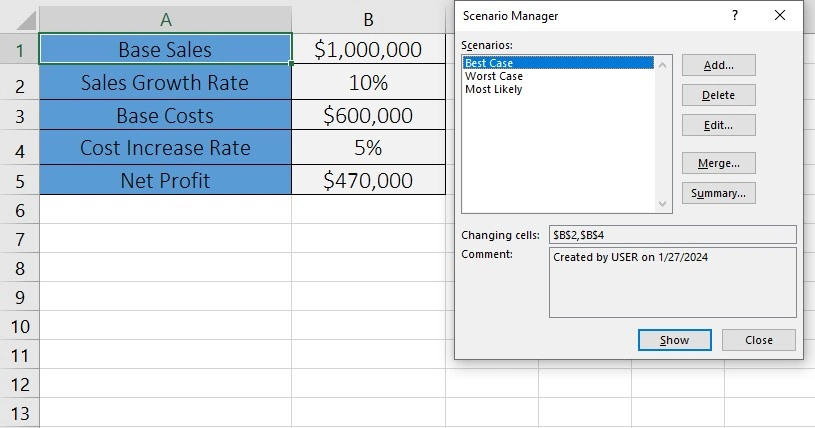
Once your scenarios are set up, you can select each of them and click “Show”. As you switch between scenarios, Excel will automatically update the Sales Growth Rate and Cost Increase Rate values, and you will see how each scenario impacts the Net Profit.
B. Applying Goal Seek for Dynamic Goal-Setting
Goal Seek is a powerful tool for decision-making with Excel and works by finding the input value needed to achieve a specific goal. It’s a form of reverse engineering in your data analysis. For example, if you want to achieve a certain profit margin but are unsure what sales volume is required to meet that margin, Goal Seek will search for the correct input value.
Assume you have a basic financial model that includes the following:
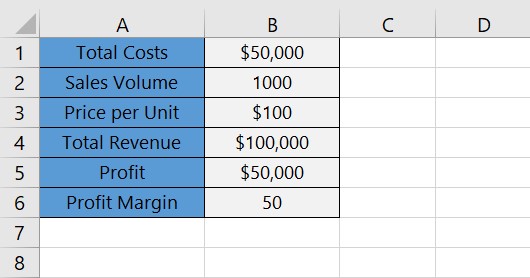
Profit Margin is calculated as (Profit / Total Revenue) * 100
You want to find out how many units need to be sold (Sales Volume) to achieve a 30% profit margin while keeping the Total Costs and Price per Unit constant.
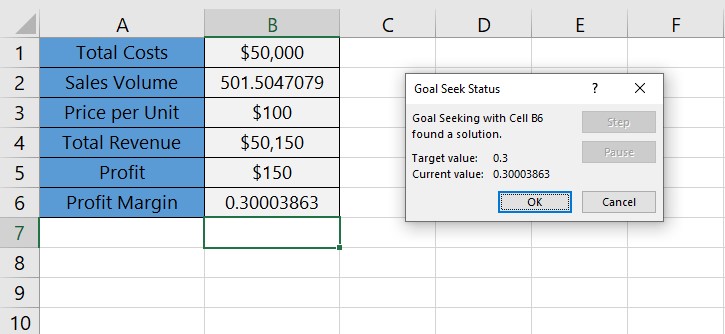
To perform Excel goal seek analysis, go to the Data tab > Forecast > What-If Analysis > Goal Seek.
In the dialog box:
- Set cell: Select the cell where your Profit Margin is calculated (e.g., B6).
- To value: Enter the target profit margin (e.g., 30% or 0.30).
- By changing cell: Select the cell that you are allowing to change (Sales Volume, e.g., B2).
- Click “OK” to run Goal Seek. Excel will iteratively try different values for Sales Volume until it finds the one that results in a 30% profit margin.
C. Real-world Applications and Examples
The applications of Scenario Manager and Goal Seek in the business environment are vast and varied. For instance, a marketer might use Scenario Manager to assess the impact of different advertising budgets on market penetration or use Goal Seek to determine the required increase in advertising spend to achieve a specific increase in sales.
In investment analysis, an analyst might use Scenario Manager in Excel to understand the impacts of different market conditions on investment returns or apply Goal Seek to find the required rate of return needed to reach a specific investment goal. These tools perfectly exemplify the transformative power of advanced Excel features for business insights.
VI. Customizing Excel with Macros
Using Excel Macros for automation is a great step for maximizing productivity in data analysis. Macros are sequences of commands that are recorded while the user performs repetitive tasks in Excel. Once recorded, these Macros can be played back to repeat the tasks, automating repetitive processes automatically. Macros and VBA (Visual Basic for Applications), Excel’s programming language, offer a level of customization that can transform the way you interact with data.
A. Creating and Editing Macros for Repetitive Tasks
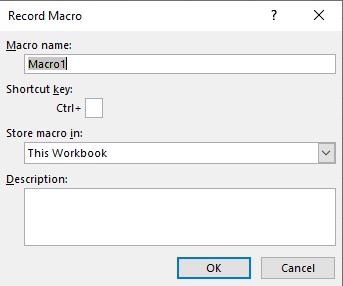
- To record a Macro, go to the Developer tab > Code > and click “Record Macro”.
- Then, you need to give a name and set a shortcut key (optional) for the Macro.
Creating a Macro in Excel is straightforward.
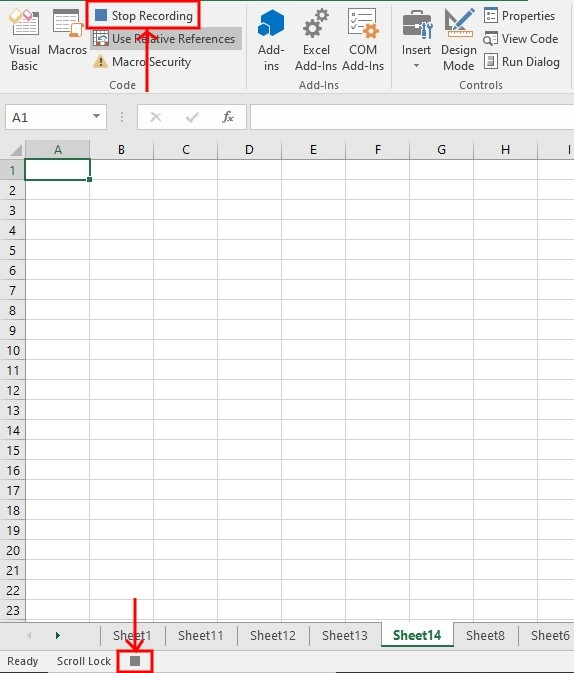
Once you click “OK,” the Macro starts recording your actions. You can make any changes you want in the Excel sheet and then click Stop Recording to save the Macro.
This way, you simply record a sequence of actions, and Excel converts these actions into VBA code. Later, you can execute these actions, eliminating the need for manual repetition. To access your previously recorded Macros, go to the Developer tab > Code > Macros.
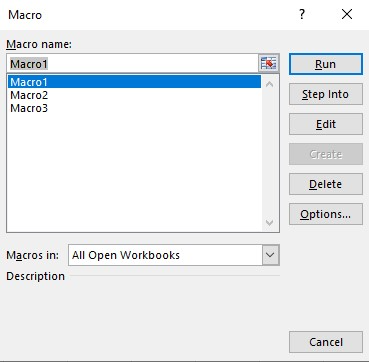
Here, you can access all the available Macros and run or edit any of them you like. Editing a Macro might require a basic understanding of VBA, allowing you to optimize the recorded actions.
B. Incorporating VBA (Visual Basic for Applications) for Enhanced Customization
If you need more than what simple Macros can offer, you can rely on VBA. As mentioned earlier, VBA is a programming language that was exclusively developed for Microsoft applications. It allows you to write scripts in Excel that can automate complex data operations. With VBA, you can create custom functions, automate interaction with other applications (like Outlook or Word), and even control Excel’s interface to suit your specific needs.
Although VBA offers a high level of automation, not everyone can leverage it effectively. You’ll probably need to spend a lot of time learning and mastering VBA to automate your tasks seamlessly. You’d better trust a well-qualified Excel expert to develop custom VBA solutions for your business. Our experts in BSUITE365 are ready to assist you with your VBA projects. Don’t hesitate to reach out!
VII. Data Visualization with Advanced Charts
Effective data visualization can turn complex datasets into clear narratives in the landscape of advanced Excel features for business insights. Excel offers a variety of advanced charts and visualization techniques, enabling users to present data in a visually appealing manner.
A. Exploring Advanced Chart Types in Excel
Advanced chart types like Waterfall, Sunburst, Histogram, and Box & Whisker provide attractive ways of presenting data, each useful for specific types of analysis. For instance, a Waterfall chart is perfect for visualizing the cumulative effect of sequential values and perfect for financial analysis or inventory tracking. Understanding when and how to use these charts is crucial in strategy analysis using Excel. By choosing the right type of chart that best represents your data, you can ensure that your visualizations are informative and engaging.
B. Techniques for Effective Data Visualization
Data visualization techniques can significantly enhance the interpretability of your charts. Adhere to these best practices when creating advanced charts, graphs, or dashboards:
- Balance Aesthetic Appeal and Clarity
- Keep a balance where the visual appeal does not overshadow the clarity of the information.
- Use design elements to guide the viewer’s focus to the most important parts of the data.
- Choosing the Right Color Scheme
- Colors should be used to differentiate data points or categories, not to decorate.
- Use a consistent color scheme across all visuals for a unified look.
- Consider colorblind-friendly palettes to make your charts accessible to a wider audience.
- Judicious Use of Labels and Annotations
- Use labels and annotations to explain unusual data points or trends.
- Keep labels concise and readable, avoiding overly complex language.
- Position labels and annotations so they don’t obstruct the data.
- Maintaining a Clean and Organized Layout
- Ensure your charts are not overcrowded. Too much information can be overwhelming.
- Align elements neatly and use white space effectively to make the chart more readable.
- Organize data logically, keeping in mind how the viewer’s eye travels across the chart.
- Avoiding Misleading Scales
- Avoid manipulating scales to exaggerate trends or differences.
- Start axes at zero where appropriate, especially in bar charts, to give a true representation of data proportions.
C. Creating Interactive Dashboards for Business Insights
Interactive dashboards in Excel elevate data visualization to a new level. They consolidate various charts and metrics into a dynamic interface, providing a comprehensive view of business performance. Dashboards allow users to filter, sort, and analyze data in real-time, facilitating a deeper exploration of business insights.
To create an interactive dashboard, you must integrate various advanced Excel features for business insights, such as PivotTables, slicers, and advanced charts. The result is a powerful tool that enables you. to monitor trends and key metrics in real-time. If timely and informed decisions are vital for your business, an interactive dashboard can be your strategic asset!
VIII. Forecasting Trends with Excel
Forecasting is a fundamental aspect of business strategy, allowing companies to anticipate market trends and stay ahead of the competition. Excel, with its advanced analytical capabilities, serves as a powerful tool for forecasting trends and can be used to generate accurate business insights.
A. Time-Series Analysis in Excel
Time-series analysis involves the study of data points collected at specific time intervals. Excel’s built-in functions and charts provide a robust framework for conducting time-series analysis, allowing you to decompose your series into trend, seasonal, and irregular components. Time-series analysis enables analysts to recognize patterns in business metrics over time, forecasting future business operations.
If you are interested in learning more about time-series analysis in Excel, we recommend you read our blog post about this subject.
B. Using Excel for Trend Forecasting and Prediction
Excel offers different trend forecasting and prediction tools, enabling businesses to make projections based on historical data. Tools like the Forecast Sheet feature, exponential smoothing functions (ETS), and regression analysis functions are useful for this purpose. The Forecast Sheet automatically detects a time series pattern in your data and provides future predictions with confidence intervals. Techniques like moving averages or exponential smoothing help in smoothing out fluctuations in data, making the underlying trends more apparent.
C. Incorporating Historical Data for Accurate Insights
The accuracy of any forecast depends on the quality of the historical data used. Incorporating historical data into your Excel models allows you to create a baseline for your forecasts. You also need to analyze the data to understand the factors that influenced past trends and how they might evolve in the future. It is especially important when your business can be influenced by external factors, such as market trends or consumer behavior. When you use Excel’s forecasting capabilities effectively, you can transform raw data into a strategic tool, navigating the future with confidence.
IX. Collaboration and Sharing Features
Excel offers robust features for collaboration and sharing, making it an ideal platform for team-based data analysis. These advanced Excel features for business insights facilitate teamwork, secure sharing of workbooks, and enable real-time collaboration.
A. Utilizing Excel’s Collaboration Features for Teamwork
Excel’s collaboration features are designed to streamline teamwork by allowing multiple users to work on the same workbook simultaneously. Features like co-authoring enable team members to view and edit the same workbook in real-time, ensuring that everyone has access to the latest version of the document. Comments and notes can also be added for specific cells, which facilitates clear communication among team members.
B. Sharing and Securing Workbooks for Collaborative Insights
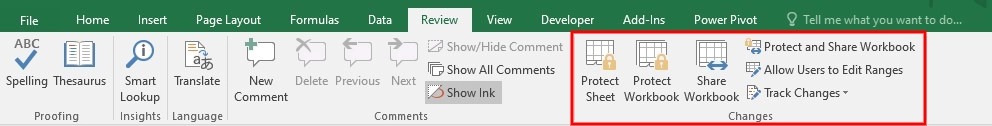
When you share workbooks with your peers, you need to ensure that data remains secure. Excel provides options to protect workbooks with passwords, restrict permissions for specific users, and even lock certain cells or sheets to prevent unauthorized editing. You can access these settings by navigating to the Review tab > Changes section.
C. Real-time Collaboration in Excel Online
Excel Online is the web-based version of Excel, accessible from any device with an internet connection. This means that team members can collaborate on workbooks in real-time, regardless of their physical location. Changes made by one user are instantly visible to others, ensuring that everyone is always on the same page.
You can access Excel Online via:
- Office.com: log in to your Microsoft account, and open Excel from the Office apps section.
- OneDrive: Go to OneDrive.com and sign in with your Microsoft account. You can create a new Excel workbook or open existing files stored in your OneDrive.
- A shared link: If someone has shared an Excel file with you via a link, clicking on the link will open the file in Excel Online.
- Microsoft 365 Subscription: If you have a Microsoft 365 subscription, log in to your account and navigate to the Excel app from the app launcher.
X. Case Studies
Many businesses harness these Excel tools to drive strategic decisions in the real world. Let’s look at case studies to illustrate the impact of advanced Excel features on business insights and decision-making.
A. Real-World Examples
Here are two examples in different sectors and industries:
- Retail Chain Optimization
A national retail chain utilized Excel’s advanced data analysis features, including PivotTables and Power Query, to optimize its inventory levels across multiple stores. By analyzing sales data, customer demographics, and inventory turnover rates, the company was able to implement a more efficient inventory management system, reducing overstock and stockouts and ultimately increasing profitability.
- Marketing Campaign Analysis
A digital marketing agency leveraged Excel’s advanced charting and scenario analysis tools to evaluate the effectiveness of different marketing campaigns for its clients. By creating interactive dashboards that showcased metrics like click-through rates, conversion rates, and ROI, the agency provided its clients with clear, actionable insights, leading to more targeted strategies.
B. Impact on Decision-Making and Strategy
By utilizing these tools, organizations are able to analyze complex datasets more efficiently, leading to more informed decisions. Here’s how:
- Improved Data Analysis and Interpretation
PivotTables, complex formulas, and Power Query allow businesses to process large volumes of data, leading to a deeper understanding of KPIs.
- Enhanced Forecasting and Planning
Businesses can predict future trends based on historical data, creating more accurate budgets, sales forecasts, and business plans.
- Scenario Analysis for Risk Management
Scenario Manager and Goal Seek allow businesses to simulate different scenarios and understand potential outcomes, enabling them to prepare strategies for various market conditions.
- Automation for Efficiency
Using Macros and VBA scripts automates repetitive tasks, thus saving time and reducing the likelihood of errors.
- Data-Driven Decision Making
Businesses can base their strategies on data-driven insights, minimizing guesswork and enhancing the quality of decisions.
- Enhancing Collaboration in Strategy Formulation
The ability to share and work on documents simultaneously improves strategy development teamwork, considering diverse decision-making perspectives.
XI. Tips for Implementation
Mastering advanced Excel features for business insights is not free from challenges. Let’s review some practical tips for implementing advanced Excel features and overcoming common challenges.
A. Practical Tips for Implementing Advanced Excel Features
Consider these Excel implementation tips:
- Start with a Clear Objective: Before using advanced features, define what you aim to achieve with your data analysis to utilize the right Excel features.
- Organize Your Data Effectively: Ensure your data is clean, accurately formatted, and organized logically before using advanced features.
- Master One Feature at a Time: Focus on mastering one feature at a time, starting with the ones most relevant to your immediate needs.
- Embrace Automation: Learn to use Macros and VBA to automate repetitive tasks, saving time and minimizing the risk of errors.
B. Overcoming Common Challenges
As your journey is prone to many challenges, have these tips in mind for managing them:
- Handling Large Datasets: Excel can slow down with large datasets. Consider using Power Query for data transformation and Power Pivot for data modeling.
- Staying Updated: Excel’s functionalities are constantly evolving. Stay updated with the latest versions to ensure you’re leveraging the most advanced tools.
- Dealing with Compatibility Issues: Test your workbooks across different versions to ensure compatibility, especially when sharing files with users having different versions of Excel.
C. Recommended Resources for Further Learning
For those eager to learn more about Excel’s advanced features, here are some useful resources:
- Microsoft Learn: An excellent resource for free, official tutorials ranging from basic to advanced levels.
- Online Forums and Communities: Platforms like Stack Overflow, Reddit’s r/excel, and the MrExcel Forum are great for learning and sharing knowledge.
- Books and E-books: There are numerous comprehensive guides, like “Power Query for Power BI and Excel” and “Excel Bible,” written by Excel experts, offering helpful insights.
XII. Conclusion
Throughout this blog post, we answered this question: “What are advanced Excel features for business Insights?” These features can significantly help you convert raw data into interpretable insights, streamlining informed decision-making. We encourage you to not only explore these features but apply them practically in your business scenarios. If you have any questions or need help with your Excel projects, feel free to reach out. We’ll be glad to help!
FAQs
PivotTables and PivotCharts are essential for business insights with Excel, allowing for efficient summarization and visualization of large datasets. They enable businesses to easily identify trends, patterns, and anomalies in their data, which is vital for informed decision-making.
Data validation is crucial for maintaining accuracy and consistency in datasets, ensuring reliable business insights. It helps minimize errors and ensure that the data used for analysis is correct and applicable to the specific business context.
Power Query is a powerful tool in Excel for data transformation, facilitating efficient importing, cleaning, and reshaping of data. It simplifies the process of preparing data for analysis, making it easier to derive meaningful business insights from diverse data sources.
Advanced Excel formulas, like VLOOKUP, INDEX-MATCH, and array formulas, enable complex calculations and data analysis. They are vital for handling sophisticated data tasks and extracting deep insights crucial for strategic business decision-making.
Scenario Manager and Goal Seek in Excel are crucial for strategic planning and forecasting. They allow businesses to prepare for various outcomes and find specific solutions to achieve desired goals, enhancing the quality of business decisions.
Excel Macros and VBA play a significant role in automating repetitive tasks and streamlining business processes. They enhance efficiency and accuracy in data handling, allowing businesses to allocate more time to strategic analysis and less to manual data manipulation.
Excel offers tools like trendlines, forecasting functions, and PivotTables for analyzing historical data and forecasting trends. These features are crucial for businesses to predict future patterns, plan strategically, and make informed decisions based on past performance.
Excel’s collaboration features, such as real-time co-authoring, sharing options, and Excel Online, support teamwork and enhance the collective effort in data analysis. They ensure that teams can work together efficiently to derive comprehensive business insights.
Many businesses across sectors have benefited from advanced Excel features. Retailers have optimized inventory through PivotTables, financial firms have used complex formulas for risk assessment, and marketing agencies have leveraged data validation and Power Query for accurate campaign analysis, all leading to enhanced business insights and decisions.
Our experts will be glad to help you, If this article didn’t answer your questions. ASK NOW
We believe this content can enhance our services. Yet, it’s awaiting comprehensive review. Your suggestions for improvement are invaluable. Kindly report any issue or suggestion using the “Report an issue” button below. We value your input.


