Scenario Analysis in Excel for Better Decision Making
Have you ever wondered how it is possible to analyze your data based on different scenarios? For example, what may happen if you increase the budget of your marketing programs by 50 percent? What if it is less than that amount? What if it’s more? So, here you may have different scenarios to check. How is it possible? Scenario analysis Excel is the tool that can help you see the results of such schemes.
What is scenario analysis Excel?
When it comes to using scenario analysis in Excel, we first need to know what a scenario is and how it’s used. A scenario is a set of different values in Excel that you create and save to see results based on each of them. You can have up to 32 different values for each scenario, and whenever one value changes, the result will automatically change based on that. That’s the power of the What-If Analysis tool, which is accessible from the Data tab on Excel.
Enhance your productivity and efficiency with our comprehensive Excel Automation Services, designed to simplify complex tasks and save you valuable time.
How to check different scenarios in Excel?
First, we need to create different scenarios based on the available data. So, we’ll start with the simplest example. Let’s say we have put our money into a marketing plan: we have some products to sell, and we need to know how many products we ought to sell to have a profit. Here we can have different scenarios, how many sold items are good, how many are bad, and how many are enough? In the end, we need to check if we should increase the price of the products to have profit. Let’s see what happens.
In our example, we keep 10,000$ as our marketing budget. We have one item to sell. Assume the price of this product is 100$. Here, the scenario is based on the number of products sold. First, look at this table.
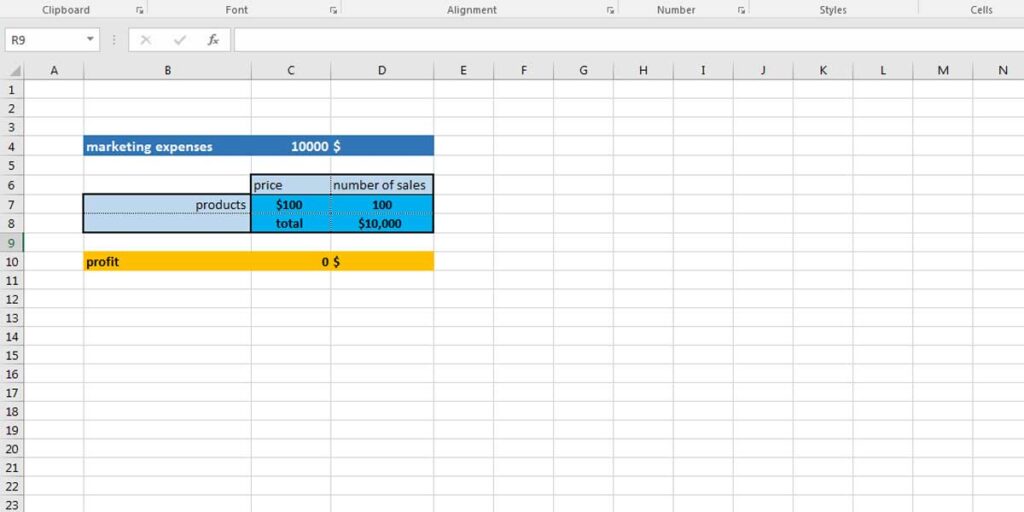
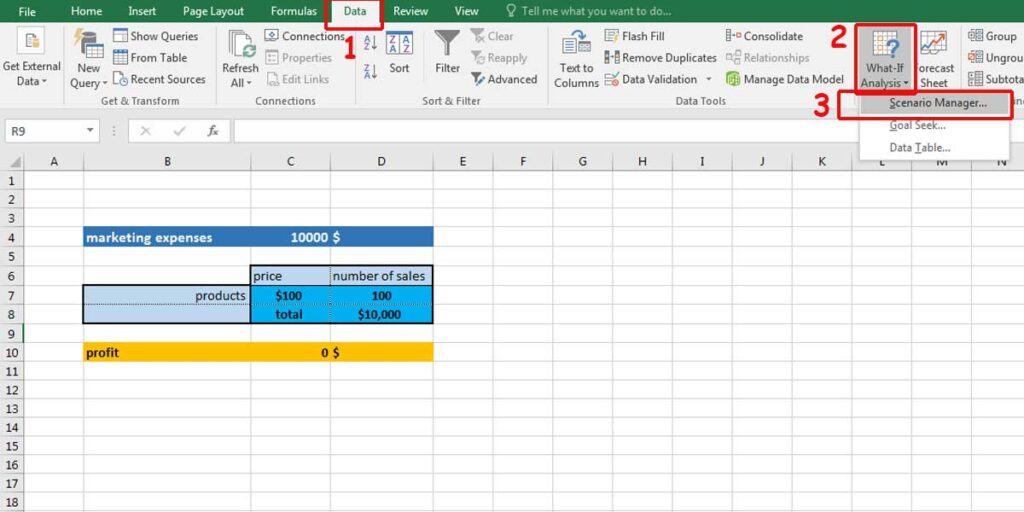
In this example, we know if we sell 100 products, we won’t have any profit, and we won’t have any loss either. So, here is one scenario we can write. To write a scenario in Excel, you should go to the Data tab and click on What-if Analysis in the Forecast section. You will see three options. We start with Scenario Manager.
Boost your productivity by getting a free consultation from Excel experts, and discover tailored solutions to optimize your data management and analysis.
What does Scenario Manager do on Excel?
Scenario Manager is where we can add different scenarios, each with a different value and result. When you click on this option, a dialogue box opens where you can add your preferred scenario. Follow these steps:
- Click on Add to see the next step, where you can add the value.
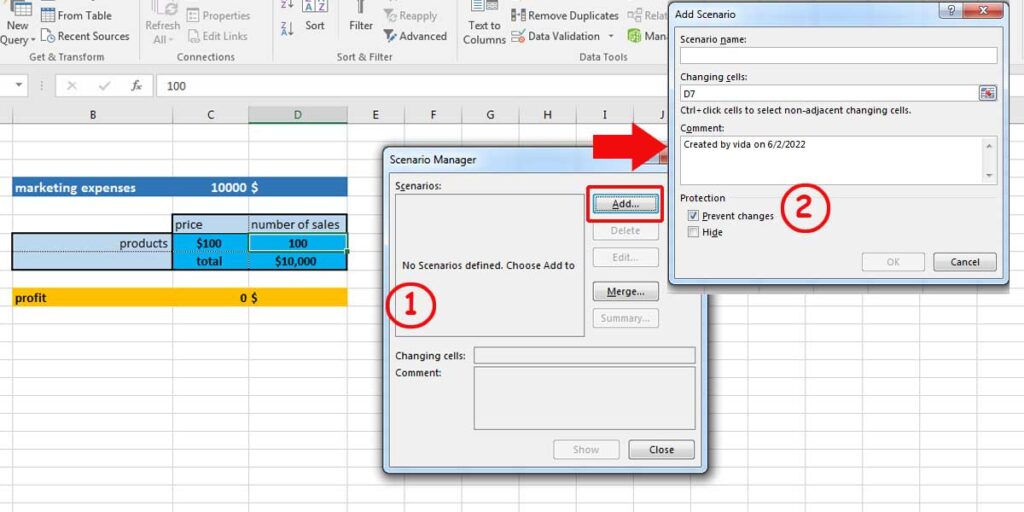
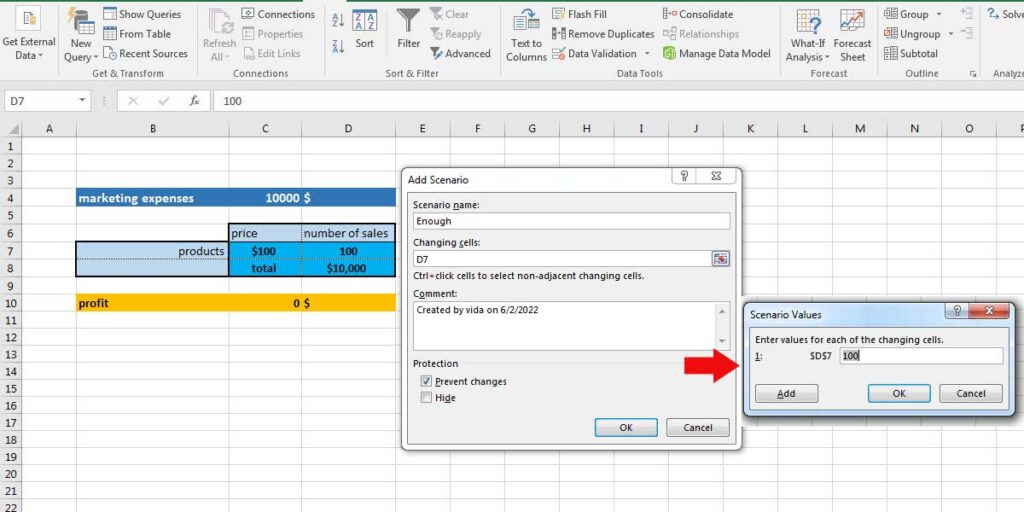
- Here, you can write a name for the scenario you are setting. In our example, we’ll call it “Enough“. It’s when our profit is equal to zero, so we know we have no loss on our project.
- Our variable cell is D7, which we’ll select and add the value. In our example, we’ll assume that selling 100 products is enough.
We added two more scenarios and called them “Good” and “Bad.” You are free to add as many scenarios as you please based on your data. Whenever you select a scenario and click on Show, the result of the table will change. In our example, we’ll assume that selling 200 products is good and selling 50 products is not.
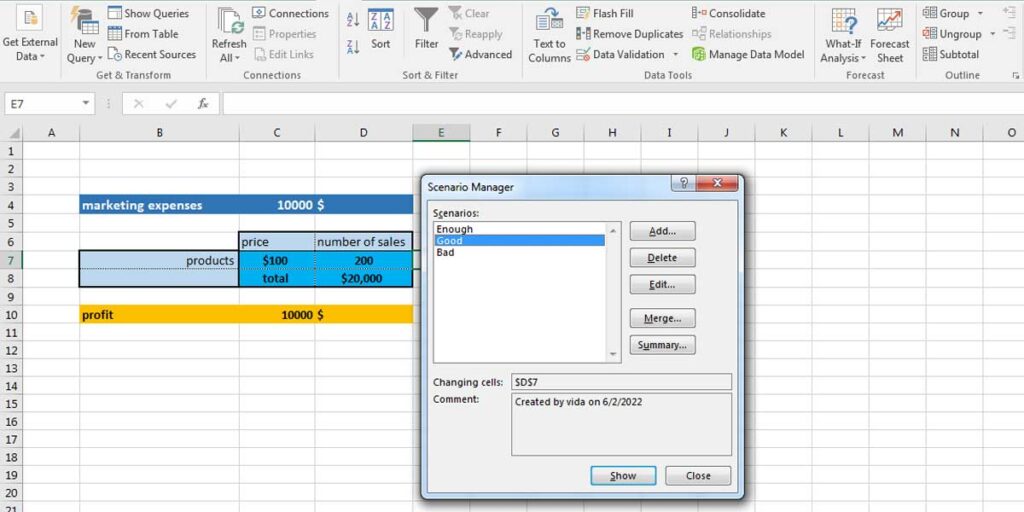
As you can see, there are other options you have on this dialogue box: Edit and Delete are clear. You can select a scenario and modify or remove it.
Merge lets you combine scenarios based on the values on different sheets.
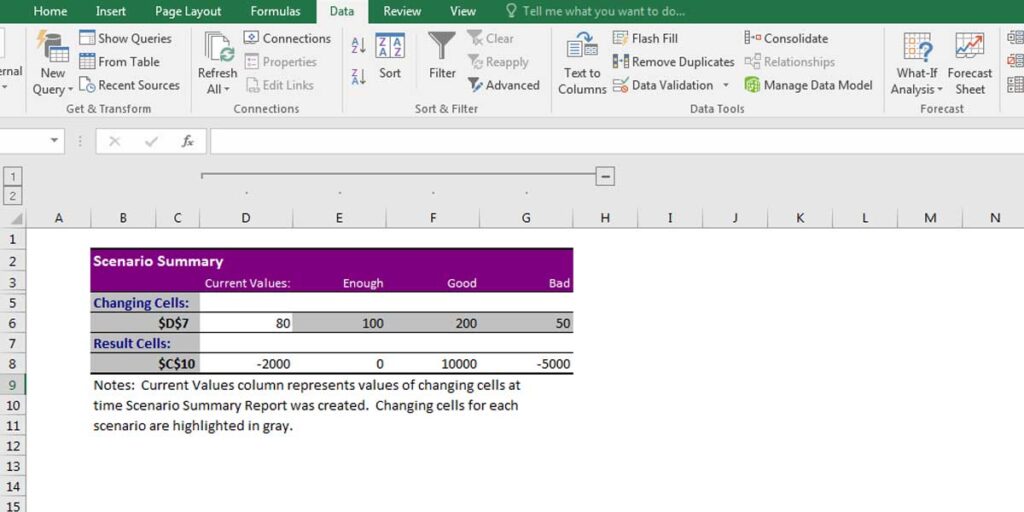
Summary gives you a report or brief of all the scenarios you have created. It is a useful option when you have many scenarios and want to compare them with each other. When you click on Summary, a dialogue box opens and asks you to choose a cell to create the summary.
Goal Seek on What-if Analysis
There are other options that can help you create a better plan using What-if Analysis. It is called Goal Seek. As its name indicates, it can help you pursue your goal. For example, your goal can be an exact amount of profit. Assume we want to gain 2000$ profit in the coming month and we only have 50 products to sell or the average sales of each product is 50. But selling 50 products is not the best option. So, what can be done? In this case, we may need to change the price.
Therefore, click on “Goal Seek,” which is one of the options for What-if Analysis. A dialogue box opens.
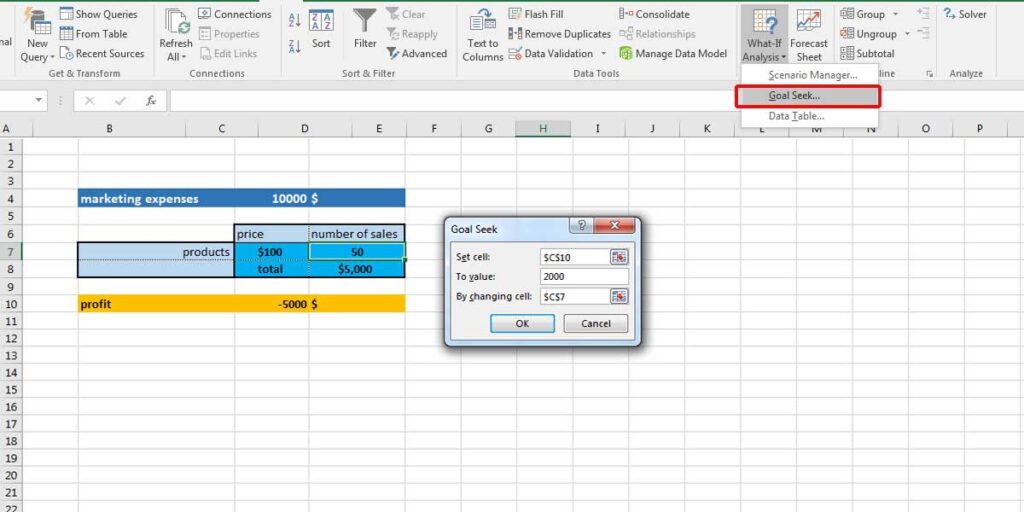
Since our goal is to reach a specific profit, we set cell C10 to the value we want. For example, 2000. The next cell is the cell we want to display the results. In our example, we want to know the price that can generate the desired profit. So we select C7. When you click OK, you will see the changes on the table as follows:
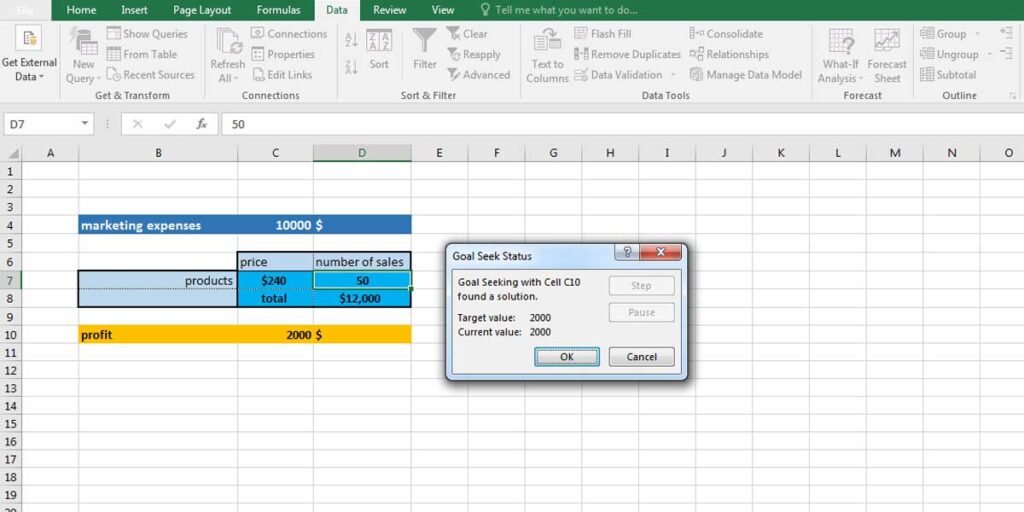
As you see in our example, if we want to have a 2000$ profit by selling 50 products, we need to increase the price to 240$.
Enhance your software capabilities with our customizable Add-In Solutions, seamlessly integrating new features to meet your business needs.
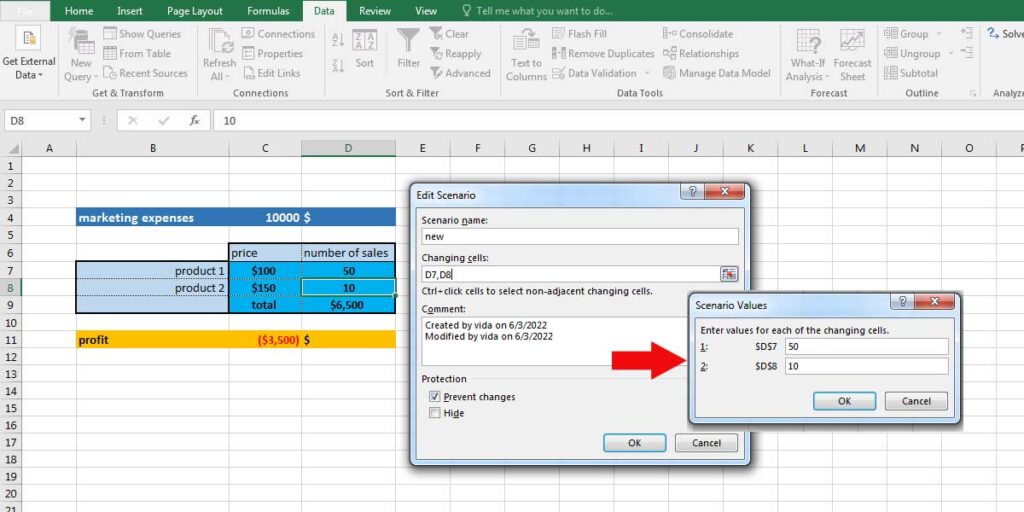
Dynamic Scenario Analysis with multiple values
Of course, our data set was a simple example of how Scenario Manager works. You can add more data to the table and write more scenarios using several cells. If your scenario is based on various cells, you can add them by pushing Ctrl on your keyboard and selecting the cell by clicking your mouse. The result will be something like this:
Tip: Note that every time you click on the Show button, the values of the table will change. Therefore, if you have a written formula in one cell, you may lose it. It’s better to keep the main table with the predefined values as one scenario, so you can return to that data anytime you want.
Bottom Line
Scenario Analysis Excel helps you compare different groups of value sets as scenarios and find the most suitable solution for your financial plans, sales and marketing, especially if it is based on a critical variable, such as the price, percentage, etc. You can consider a different scenario for your strategy and find the best and even worst cases. It’s a powerful tool that is easy to work with and very practical. If you would like to add more dynamic scenario analysis in Excel, you can combine the scenarios with Excel Conditional Formatting or work with Solver in Excel, as well.
Our experts will be glad to help you, If this article didn’t answer your questions. ASK NOW
We believe this content can enhance our services. Yet, it’s awaiting comprehensive review. Your suggestions for improvement are invaluable. Kindly report any issue or suggestion using the “Report an issue” button below. We value your input.


