How to Run and Use Monte Carlo Simulation in Excel
Are you ready to demystify the world of uncertainty and make informed decisions? Running Monte Carlo simulation in Excel is your key to doing just that. This powerful statistical technique has applications in a wide range of fields, from finance to engineering and beyond. In this comprehensive guide, we will walk through the ins and outs of Monte Carlo simulation in Excel, giving you the knowledge and skills to harness its potential for your projects.
Introduction to Monte Carlo Simulation
Imagine you’re a financial analyst assessing investment risks or an engineer evaluating the reliability of a new bridge design. In both scenarios, uncertainty lurks, making it challenging to predict outcomes accurately. This is where the Monte Carlo simulation comes to assist.
Monte Carlo simulation is a mathematical technique used to estimate a probability distribution for an output given one or more inputs, each having its own probability distribution. Its power and potency come from incorporating randomness when modeling and analyzing complex systems. It simulates thousands or even millions of possible scenarios to provide a comprehensive view of potential outcomes. John von Neumann and Stanislaw Ulam invented this method in the 1940s, and the term “Monte Carlo” refers to the administrative area of Monaco, popularly known as a place where European elites gamble.
This powerful approach can tackle various problems, including:
- Financial Risk Assessment: Analyzing investment portfolios, estimating market risks, or pricing options
- Engineering Reliability: Evaluating structural integrity, performance, or failure rates of systems
- Project Management: Predicting project timelines, costs, and resource allocation
- Quality Control: Testing the impact of process variations on product quality
- Healthcare Modeling: Simulating disease spread, drug effectiveness, and healthcare resource planning
While uncertainty is inherent in real-world problems, traditional deterministic models often fall short of capturing this uncertainty. Monte Carlo simulation, on the other hand, excels in dealing with complex systems where multiple variables interact.
By generating thousands of random scenarios, Monte Carlo simulation provides a distribution of possible outcomes. This distribution offers valuable insights, including the range of results, probabilities, and the likelihood of extreme events. Armed with this information, decision-makers can develop robust strategies, allocate resources efficiently, and make informed choices when a problem is too complex and difficult to solve by direct calculation.
Although numerous statistical tools are available for generating Monte Carlo simulations, Microsoft Excel offers a more accessible approach for simulating normal and uniform distributions, allowing users to bypass complex mathematical foundations. We will be using VBA to automate the process; this will add even more efficiency and effectiveness to our work.
In this guide, we are going to conduct a Monte Carlo simulation to predict a company’s net profit. Before getting into the Monte Carlo simulation, we will find the net profit using a conventional, deterministic method. In the end, we will compare and contrast this outcome with that of the Monte Carlo simulation to see the difference.
Enhance your productivity and efficiency with our comprehensive Excel Automation Services, designed to simplify complex tasks and save you valuable time.
Setting the Stage for the Monte Carlo Simulation
For this blog, we will perform the Monte Carlo simulation for net profit prediction. Let’s begin with specifying the list of components required for a typical Monte Carlo simulation.
Inputs
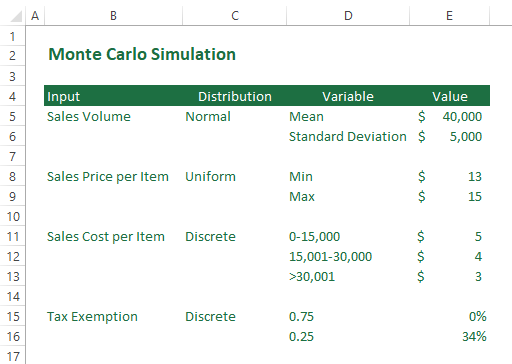
Our model has four inputs, each having its own distribution.
- Sales Volume – Normal Distribution
- Sales Price per Item – Uniform Distribution
- Sales Cost per Item – Discrete Distribution
- Tax Exemption – Discrete Distribution
Output
Our model has one output for which we will estimate a distribution using Monte Carlo simulation.
- Profit after Tax
Input-Output Equation
There is a relatively simple relationship between inputs and the output in this model, that is;
Profit after Tax = [(Sales Volume * Sales Price per Item) – (Sales Volume * Sales Cost per Item)] * (1 – Tax Exemption)
Empower your business with our Excel Programming and VBA Macro Development Services, tailored to automate tasks and unlock the full potential of your data management capabilities.
Preparing Inputs for Traditional Deterministic Model
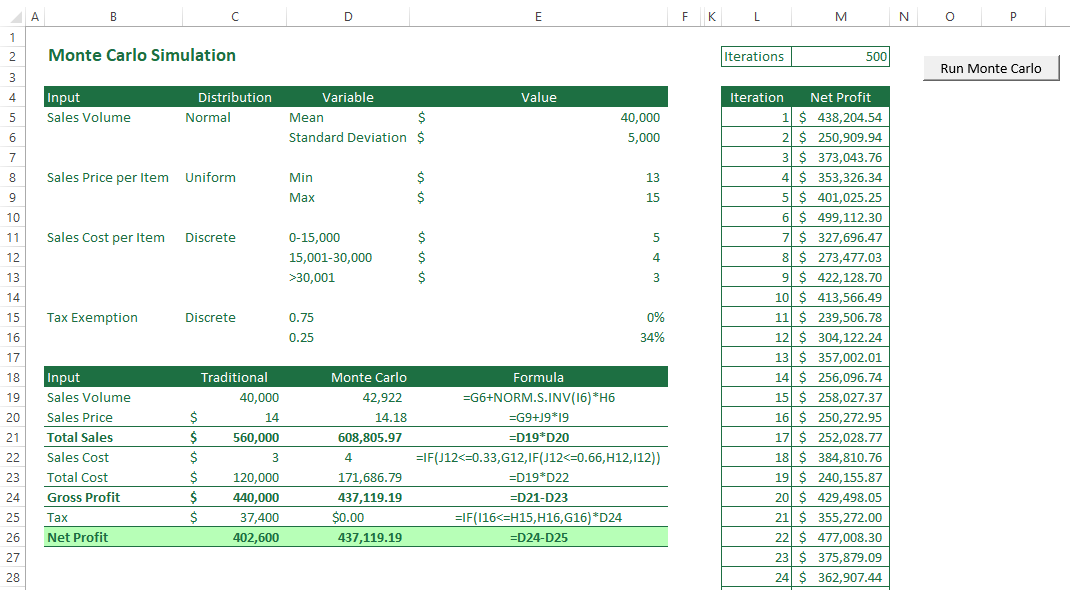
To perform the traditional simulation in Excel, we need to create the list of inputs, their distributions, and the parameters of each distribution in an Excel sheet.
Calculating Output Using a Traditional Deterministic Model
Before starting the Monte Carlo simulation, it would be inspiring to calculate the output using traditional methods that don’t care about uncertainty. So let’s do it in Excel.
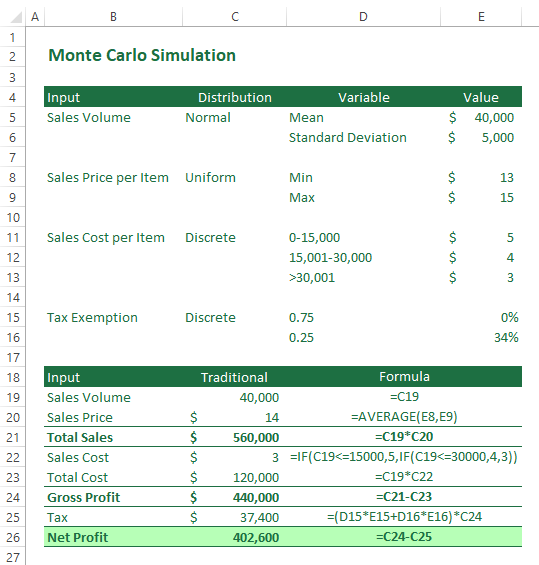
Taking advantage of using the input-output formula we discussed earlier, calculating the net profit using the traditional deterministic model is straightforward. However, as we mentioned earlier, with deterministic models, uncertainties have no role to play in the calculation of the net profit. This is far from what happens in the real world. Let’s see how the Monte Carlo simulation can eliminate this shortcoming.
Preparing Inputs for Monte Carlo
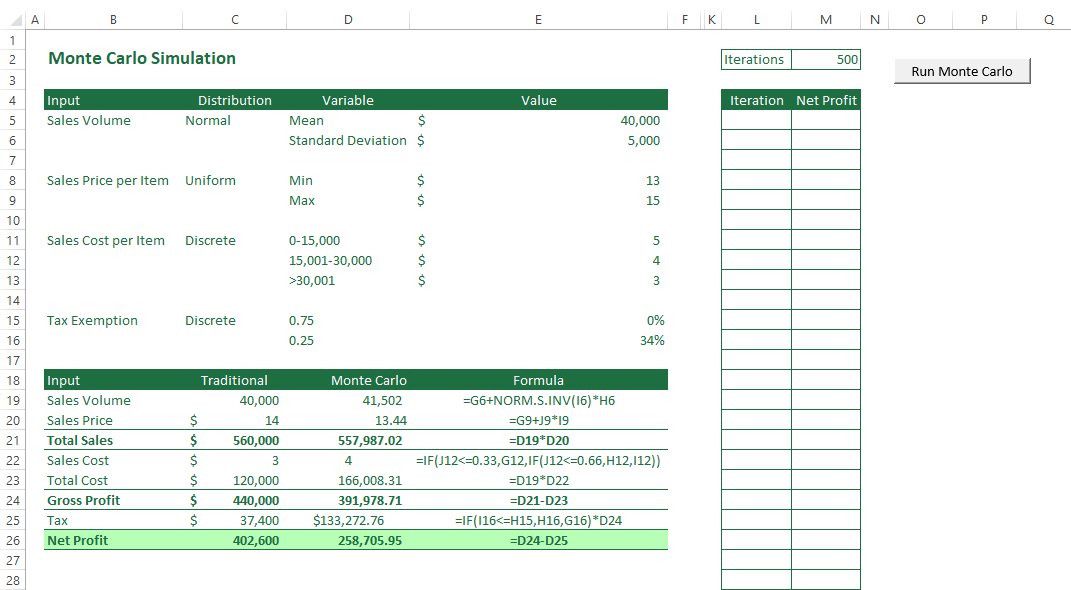
As discussed earlier, for Monte Carlo simulation, we need to take care of the uncertainty in inputs. This amounts to using the probability distribution of the inputs instead of their deterministic value. Let’s modify our Excel sheet to prepare it for the Monte Carlo simulation.
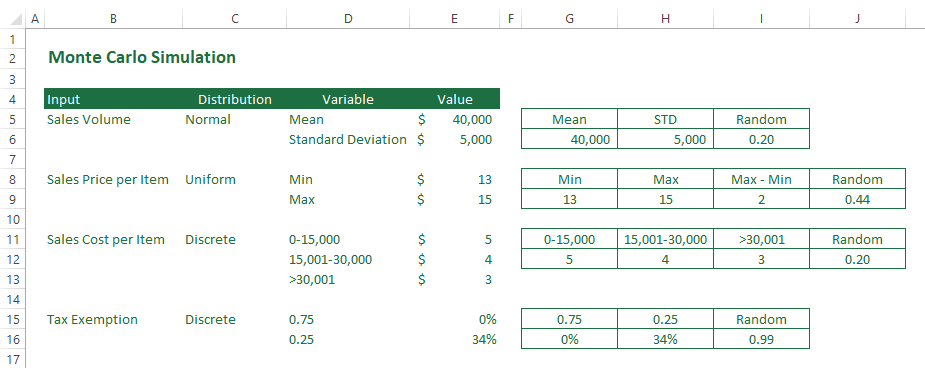
As you can see in the screenshot, we have created a small table for each input summarising the variables of its distribution. For each table, we have a column containing a random number between 0 and 1. We use the Excel RAND() function to generate random numbers. Random numbers are our means of incorporating uncertainty in calculations. Now we are ready to perform one run of Monte Calo simulation in Excel.
One Run of Monte Carlo Simulation
In the following screenshot, you can see one run of the Monte Carlo simulation. The input-output relationship is the same as the deterministic case, but we have accounted for uncertainty in calculating the net profit. So, what you are seeing in this screenshot is the net profit for one go of the Monte Carlo simulation.
With your Excel file opened, each time you press F9, the RAND() functions are recalculated, and you have a new value for the net profit.
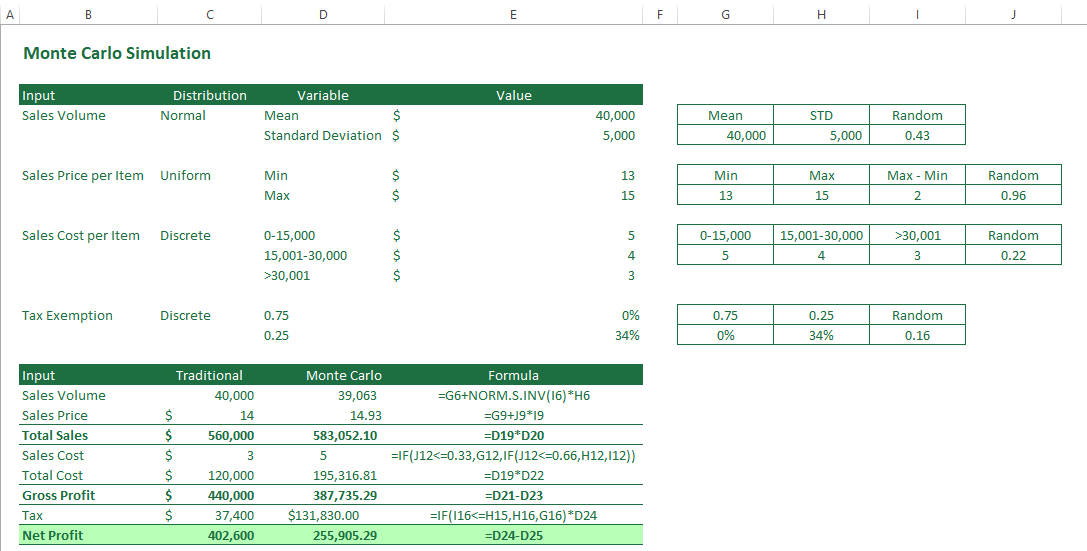
If you are interested in understanding the calculations in more detail, take a look at the following screenshot.
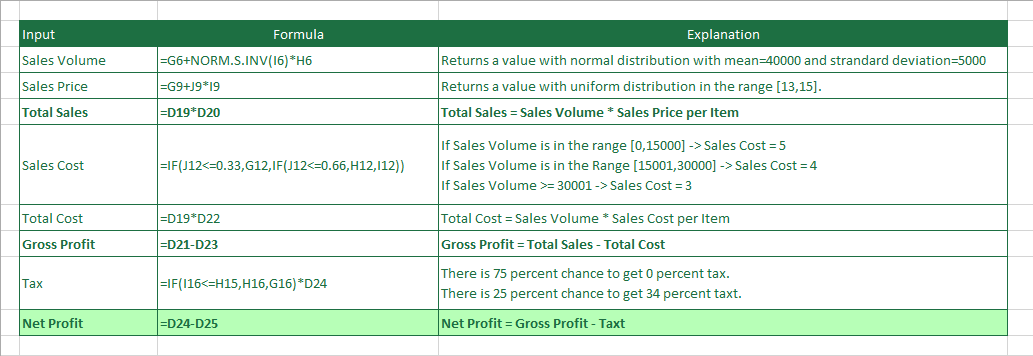
Full-Fledged Monte Carlo Simulation
We are ready to repeat the calculations we performed in the previous section to get a full-fledged Monte Carlo. As you probably know, Monte Carlo is typically repeated tens of thousands of times to give reliable results. To automate this process in Excel, we are going to write a VBA macro. Follow the following steps to automate the Monte Carlo simulation in your Excel file.
- Save your Excel file as a macro-enabled Excel file (in *.xlsm format)
- Prepare your Excel file to keep the results of the simulation.
- Prepare the space to keep the net profit for each iteration.
- Add a button to assign the macro to.
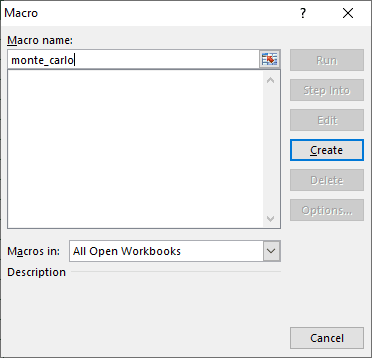
3. Go to the Developers tab and select Macros to open the Macro dialog box. Enter a name for your macro and click Create.
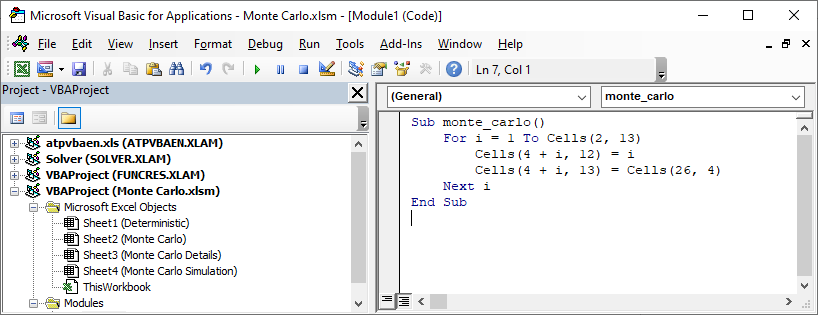
- The Microsoft Visual Basic for Applications window will open, wherein you can start writing VBA code.
- Write the following code in the editor:
Sub monte_carlo()
    For i = 1 To Cells(2, 13)
        Cells(4 + i, 12) = i
        Cells(4 + i, 13) = Cells(26, 4)
    Next i
End Sub
6. Assign the macro to the button you added to your sheet in an earlier step.
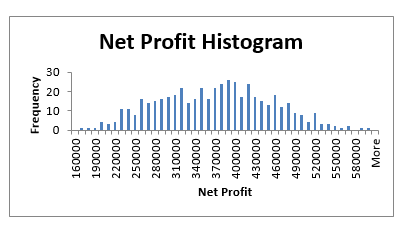
7. Click the button to run the macro, and you can see that for each iteration, a new net profit is calculated and added to the table.
8. We can calculate the average of the obtained net profits or create a chart to visualize it for deeper insight.
Conclusion
In this comprehensive guide, you’ve embarked on a journey through the world of Monte Carlo simulation in Excel. From setting up your spreadsheet to analyzing results and making informed decisions, you’ve gained the knowledge and skills to navigate the complex landscape of risk and uncertainty with confidence.
Key Takeaways
- Monte Carlo simulation is a powerful technique for uncertainty analysis with applications in various fields.
- Random number generation is crucial for creating realistic simulations.
- Defining input variables with probability distributions adds complexity and realism to your models.
- Analyzing results, visualizing data, and performing sensitivity analysis aid in decision-making.
- Monte Carlo simulation in Excel empowers decision-makers to assess risks and make informed choices.
Don’t hesitate to incorporate Monte Carlo simulations into your projects. By mastering this technique, you’re equipped to tackle the challenges of an uncertain world with data-driven precision.
FAQ
Yes, you can perform Monte Carlo simulations in Excel by utilizing built-in functions and add-ins like Solver.
Monte Carlo simulation is valuable for analyzing uncertainty, making informed decisions, and assessing risks in various fields.
You may run Monte Carlo simulation in Excel without using add-ins, but it’s more efficient and versatile with the Solver add-in enabled.
Monte Carlo simulation helps quantify and understand the uncertainty and variability associated with a given model or decision, allowing you to assess and manage risks more effectively.
Go to “File” > “Options” > “Add-Ins” > “Solver Add-in” > “Go” to enable the Solver add-in.
Yes, you can find Monte Carlo simulation free templates and tools designed for Excel if you search online.
Monte Carlo simulation is used in financial modeling, risk assessment, project management, and investment analysis to evaluate uncertainties and make better decisions.
Our experts will be glad to help you, If this article didn’t answer your questions. ASK NOW
We believe this content can enhance our services. Yet, it’s awaiting comprehensive review. Your suggestions for improvement are invaluable. Kindly report any issue or suggestion using the “Report an issue” button below. We value your input.


