How to Count Unique and Distinct Values in Excel
- Do you have an extensive set of data?
- Is it hard to search for some unique and distinct values?
- Do you need to know how many unique or distinct values you have in your data set?
When we talk about a data set, we often mean a long list that contains a wide variety of values. Sometimes showing and counting some particular values helps us to make a more concise and practical data list. For example, assume a customer’s name list. Probably, some of them are mentioned more than one time. So we need a list of the names that are mentioned only once. In other words, we need Unique names.
BTW, Assume you have a list of your customers. You need to count the number of customers, filter them normally or conditionally and get a list of them. But your dataset is too long, and values repeat more than once. Counting Distinct values helps you with this issue.
In this blog, we are going to tell you everything you need to know about counting Unique and Distinct values.
What is Unique and Distinct Value?
Assume that we have this data set:
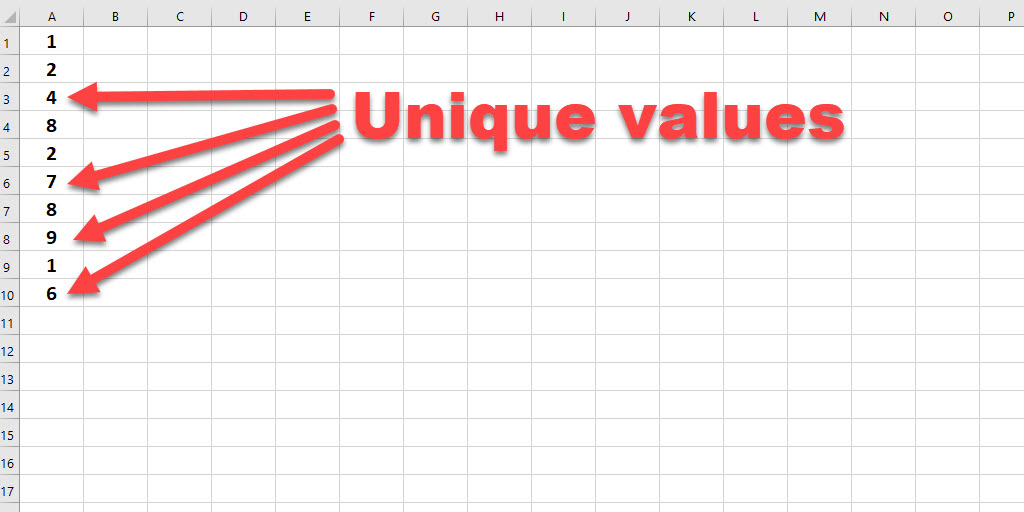
1,2,4,8,2,7,8,9,1,6
Unique Values:
Here, among these ten values, you can see some of them are mentioned once. Such as 4, 7, 9, and 6. These are Unique values.
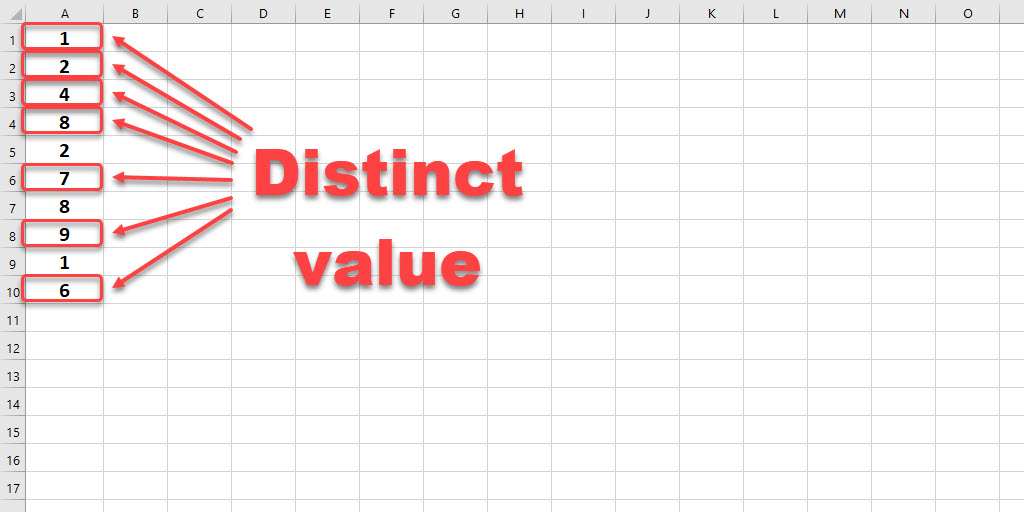
Distinct Values:
The value appearing for the first time in a data set, whether unique or repeated further, is a Distinct value.
You can count these data, filter them normally or conditionally and get a list of them.
The easiest way to count and show these values is using the If and Countif functions. So let’s proceed and learn how to use them based on your data set.
Show and Count by If and CountIf Functions
By If and CountIf functions, we determine which values are Unique and which ones are Distinct. You can see the results in figure 3 (here, we represent Unique values.)
How Do I Show Unique Values in Excel?
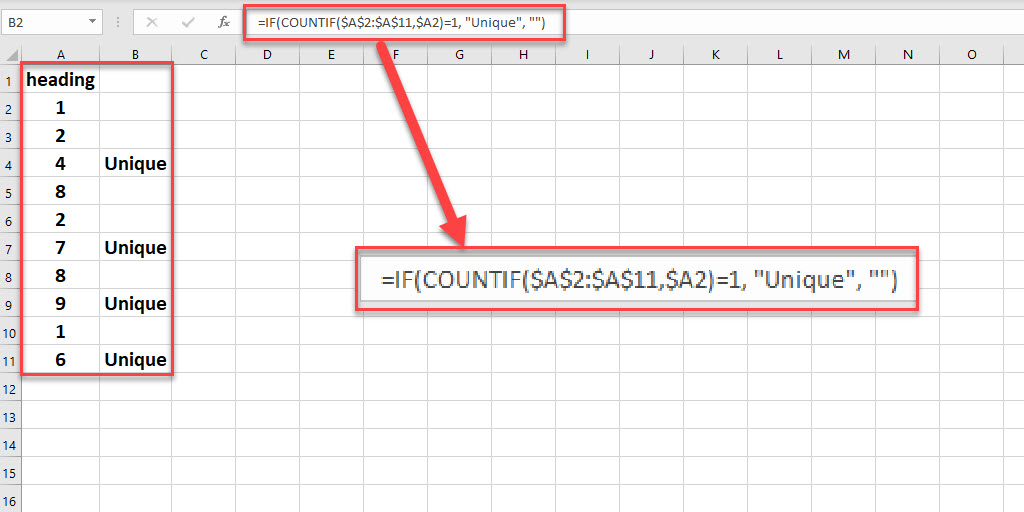
According to figure 3, Before we can count unique values, we need to detect them in our data set. Follow these steps to do so:
- Add a heading to your data set.
- Insert a column to show the result.
- Insert =IF(COUNTIF(data set range, the first cell of data set)=1, “Unique”, ” ”) syntax.
- Make sure your data set range is fixed by the dollar sign ($) with attention to figure 3.
- Fix the first cell of your data set by dollar sign according to figure 3.
The syntax:
According to our example, the syntax is:
=IF(COUNTIF($A$2:$A$11,$A2)=1, “Unique”, “”)
Be careful with the dollar signs.
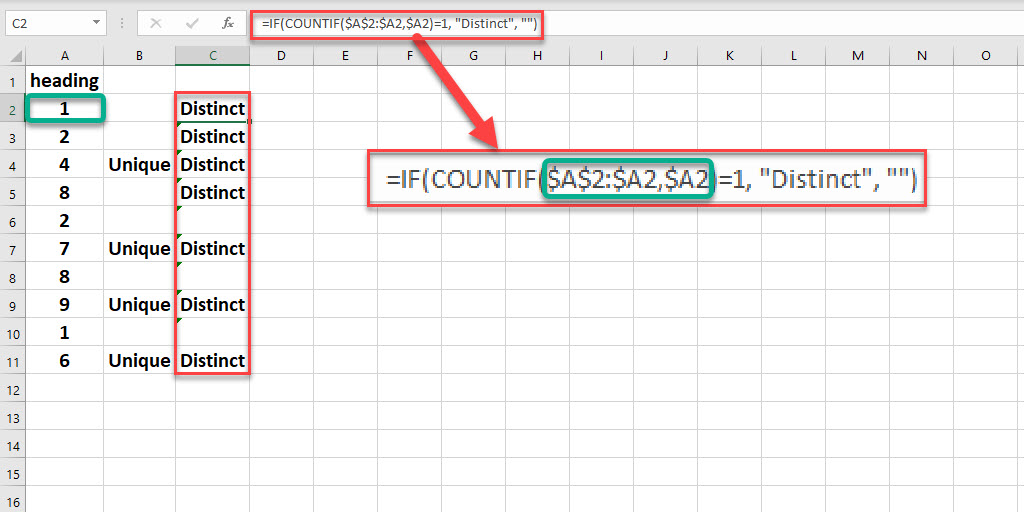
How Do I Show Distinct Values in Excel?
We follow the previous steps to specify Distinct values by using If and Countif functions.
The syntax:
According to our example, the syntax is:
=IF(COUNTIF($A$2:$A2,$A2)=1, “Distinct”, “”)
Be careful with the dollar signs.
Show Unique or Distinct Values in a Row
Sometimes, you need to show Unique or Distinct values in a row. For example, your data set may include “company” and “product.” You want to determine the Unique row as shown in figure 5.
The syntax:
According to our example, the syntax is:
=IF(COUNTIFS($A$2:$A$9,$A2,$B$2:$B$9,$B2)=1, “Unique row”, “”)
Be careful with the dollar signs.
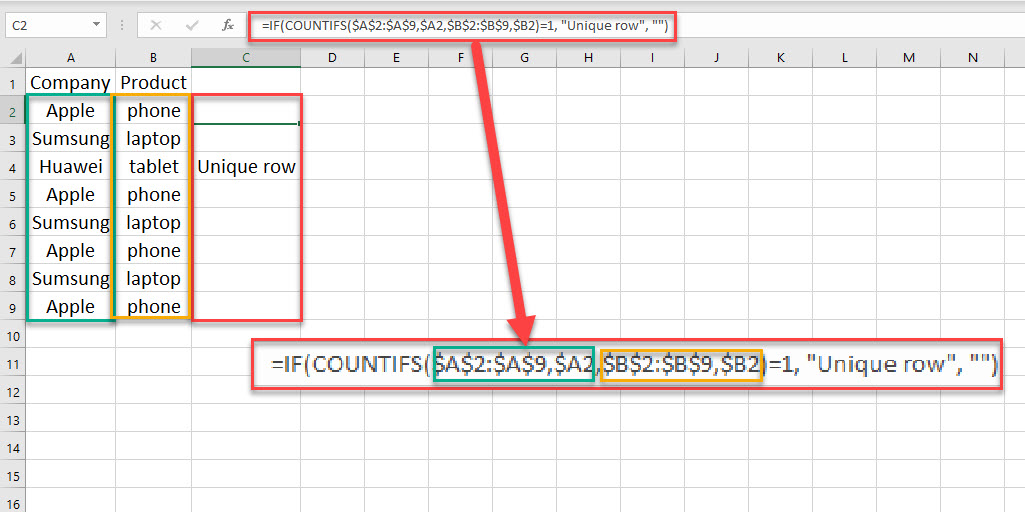
While doing every single step in the Show Unique values section,t add the second data column according to figure 5 (yellow box.)
In addition, you must use the CountIfs function instead of the CountIf.
Here to show Distinct values, follow the steps we mentioned before, in the section about Showing distinct values, however use Countifs instead of countif.
The syntax:
According to our example, the syntax is:
=IF(COUNTIFS($A$2:$A2,$A2,$B$2:$B2,$B2)=1, “Distinct row”, “”)
Be careful with the dollar signs.

Figure 6- Show the Distinct row
Sometimes you need to show Distinct values in a row. For example, your data set includes “Company” and “Product.” You want to determine the Distinct row as shown in figure 7.
The syntax:
According to our example, the syntax is:
=IF(COUNTIFS($A$2:$A2,$A2,$B$2:$B2,$B2)=1, “Distinct row”, “”)
Be careful with the dollar signs.
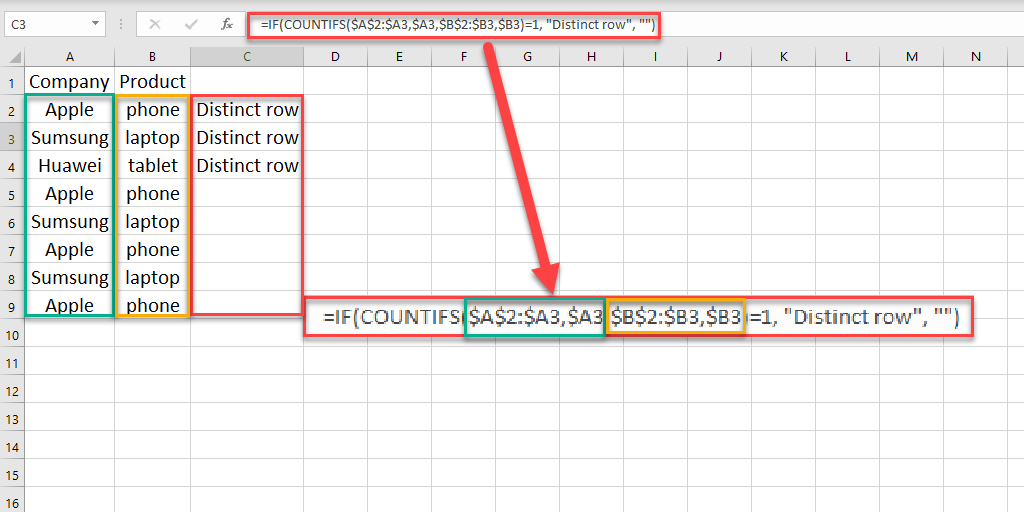
To distinguish distinct rows, repeat every single step in the Show Distinct values section, and add the second data column just like you did the first one. (See the yellow box in figure 7) In addition, you must use the CountIfs function instead of the CountIf.
Empower your business with our Excel Programming and VBA Macro Development Services, tailored to automate tasks and unlock the full potential of your data management capabilities.
If you’re interested in exploring more Excel functions that help you count data in different ways, check out our comprehensive guide to Excel COUNT functions.
The Easiest Way to Count Distinct and Unique Values
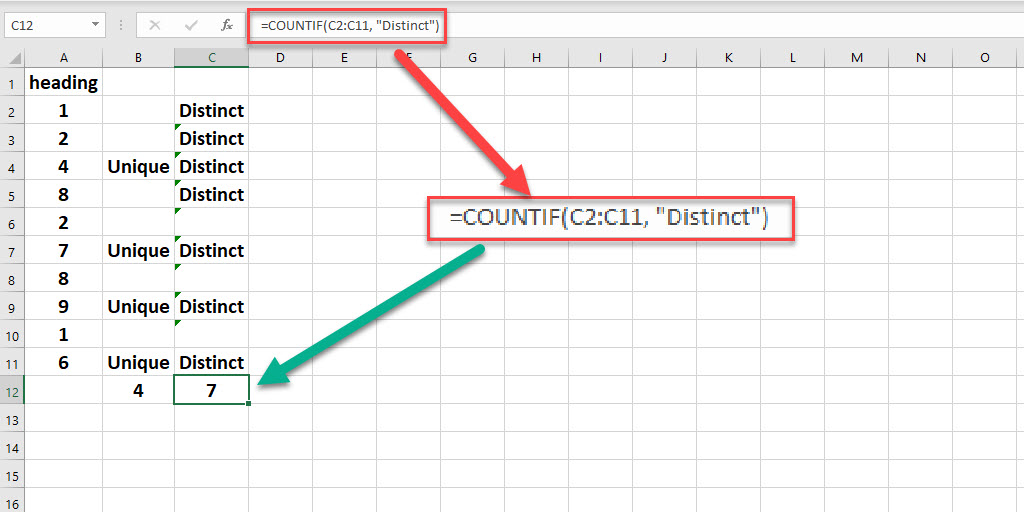
Now to count these values, you can easily use the Countif formula. For example, to count the Distinct values follow these steps:
- Show your data as Unique or Distinct values by the steps we mentioned.
- Select a cell and enter the Countif formula.
- The formula is
=countif(data range1, data range2[optional],…, “Distinct”)
- Now you can see how many Distinct values you have.
Count Unique and Distinct Values by Colour
Using this technique in Excel allows you to distinguish values by color and be able to count them easily. So let’s try it. To count Unique values, you can use the default rule. Having said that, for the Distinct values, we have to write the formula because there is no default rule in Conditional Formatting.
Count Unique Values by Conditional Formatting
Follow these steps to determine your unique value in a blink of an eye.
- Select your data set.
- Go to the Home tab.
- In the Style section, click the Conditional Formatting button.
- Click the Highlight Cells Rules.
- Select the Duplicate values from the menu.
- From the Duplicate values dialogue box, select Unique and choose the format that fills the cells by color (for example, Light red fill with dark red text.)
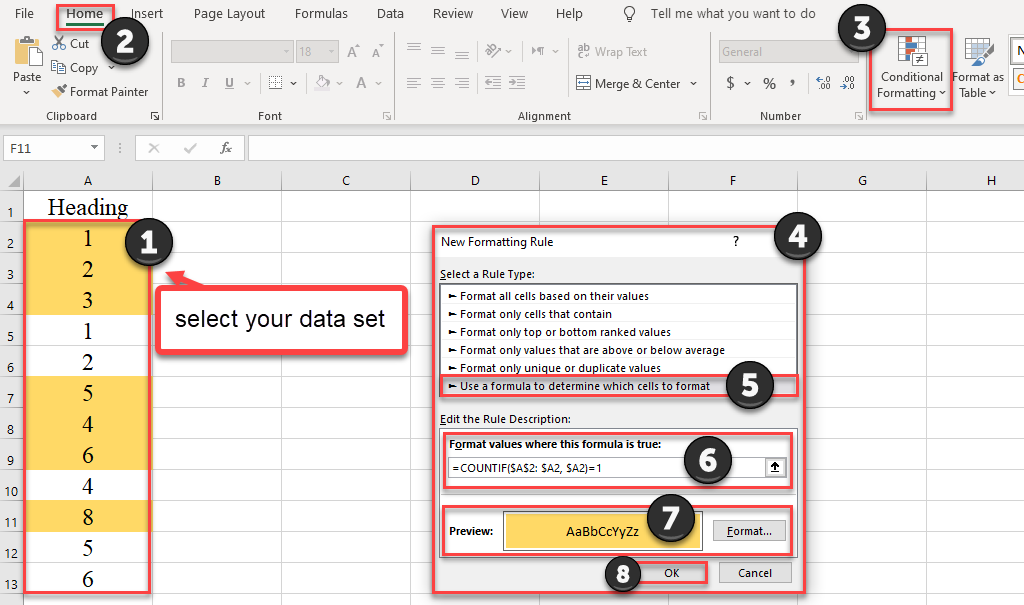
Count Distinct Values by Conditional Formatting
To determine your distinct value we follow steps 1, 2, and 3 in previous section, then do these steps:
- Click the New Rule.
- Select the Use a formula to determine which cells to format from the New formatting rule dialogue box.
- Enter this formula.
=COUNTIF($A$2: $A2, $A2)=1
- For the Preview section, click the Format button, then you can format cells by Number, Font, Border, and fill tabs.
- Press OK.
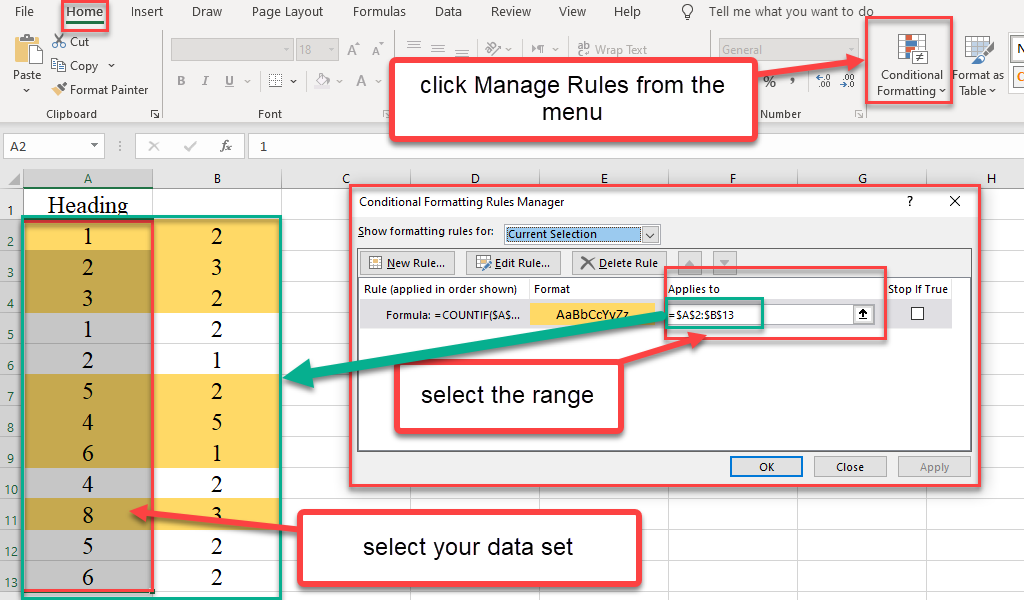
If you want to colour a row, select your dataset after following the previous steps, go to Conditional Formatting, and click Manage Rules and select your range In the Applies To section of the Conditional Formatting Rules Manager dialogue box. Then press OK.
Count Coloured Cells
Now for counting the colored cells follow these steps. There are a few ways to count colored cells. Here, we’ll count them using the Auto filter option.
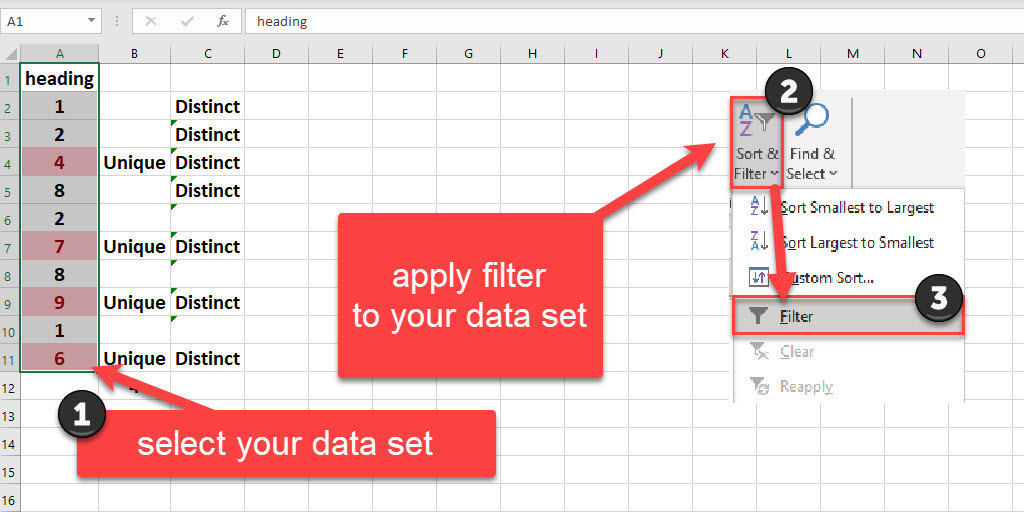
- Select your data set (select your heading too.)
- Go to the Home tab in the Editing section, click on the Sort and Filter, then click Filter (through these steps, you apply a filter to your data set.)
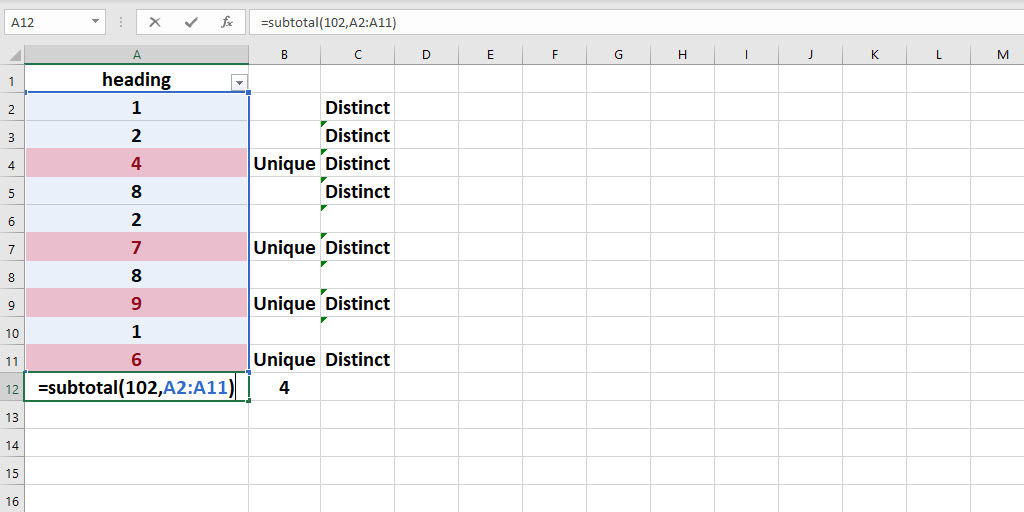
- Use the SubTotal function to count our data. Select a cell and enter the function.
=subtotal(102, data range)
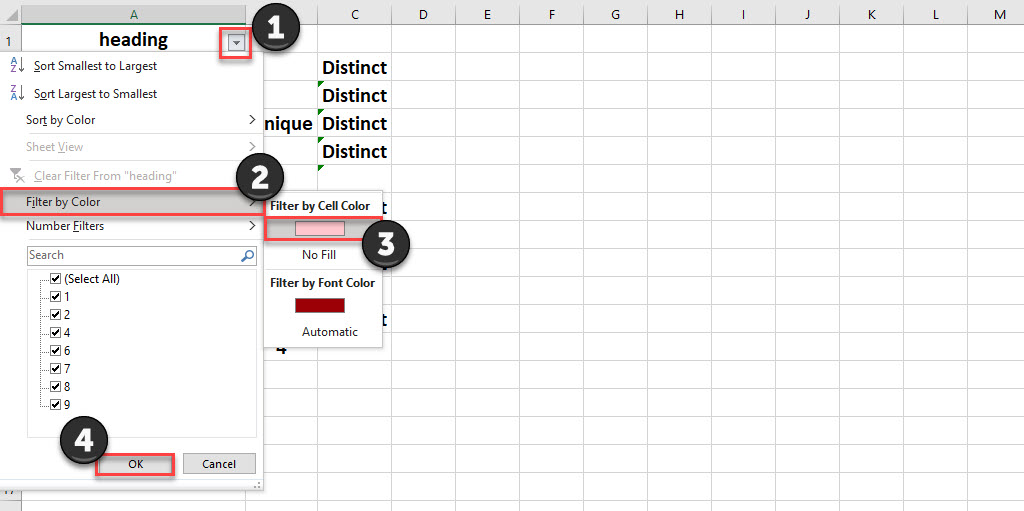
- Then click on the drop-down list filter.
- Select Filter by colour.
- Choose the colour you want to count. As you can see, we choose the light red.
Count Unique and Distinct Values by Sum and If
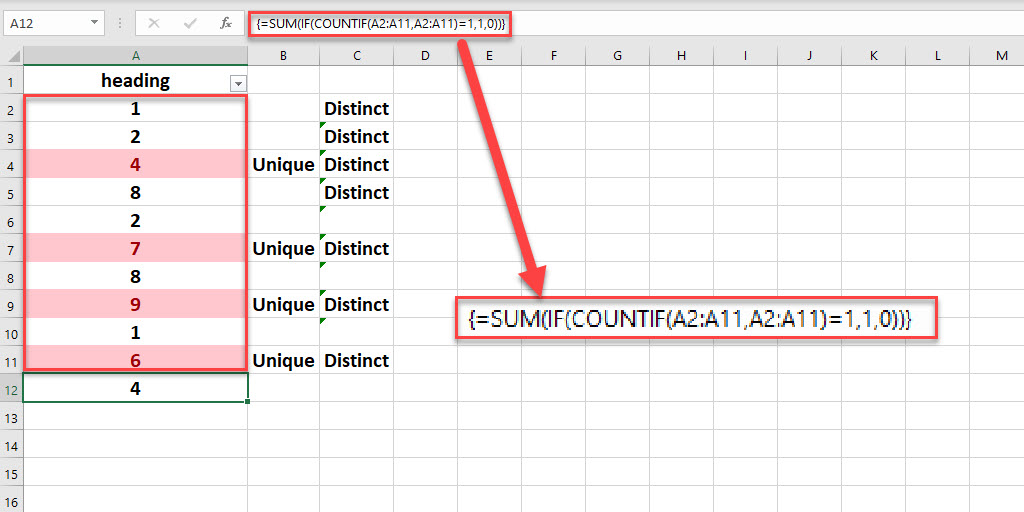
The most common way to count these values is using a combination of SUM, IF, and COUNTIF functions. Describing how these functions work for Unique values starts with the COUNTIF that specifies the repeated number for each value. Then the IF function assumes unique values as one and replaces duplicate values with zero. The Sum function sums the ones, and the final number is the number of unique values.
So, to count your Unique value, use this array formula.
=SUM(IF(COUNTIF( data range, data range)=1,1,0)))
Point: After you enter the array, you must press Shift+Ctrl+Enter.
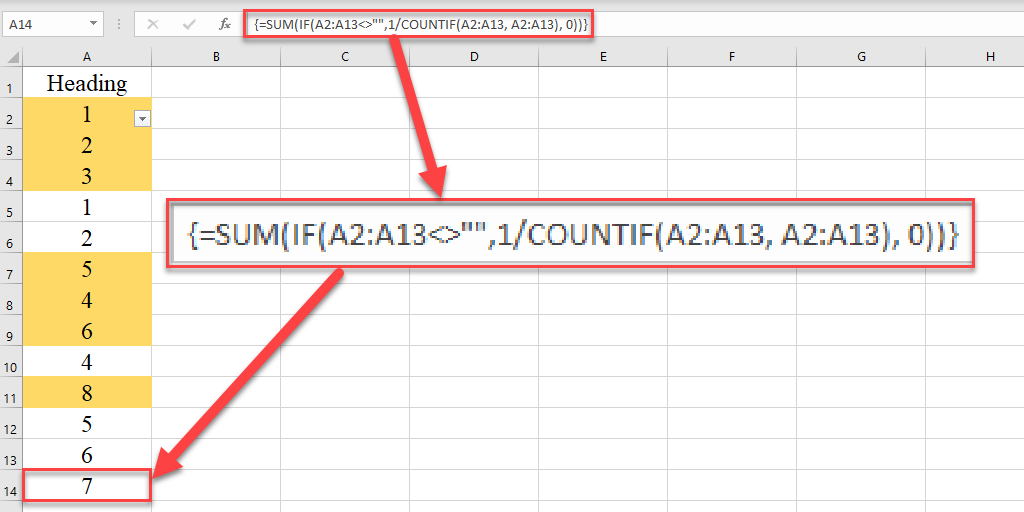
You can count Distinct values according to your data set. For example, sometimes your data set contains empty cells or includes numbers and text.
So, to count your Distinct value, use this array formula.
=SUM(IF(range<>””,1/COUNTIF(range, range), 0))
Point: After you enter the array, you must press Shift+Ctrl+Enter.
Count Numerical and Text Values
Sometimes you have either text or number in your data set. In this case, you should add the ISTEXT or ISNUMBER functions to your array formula.
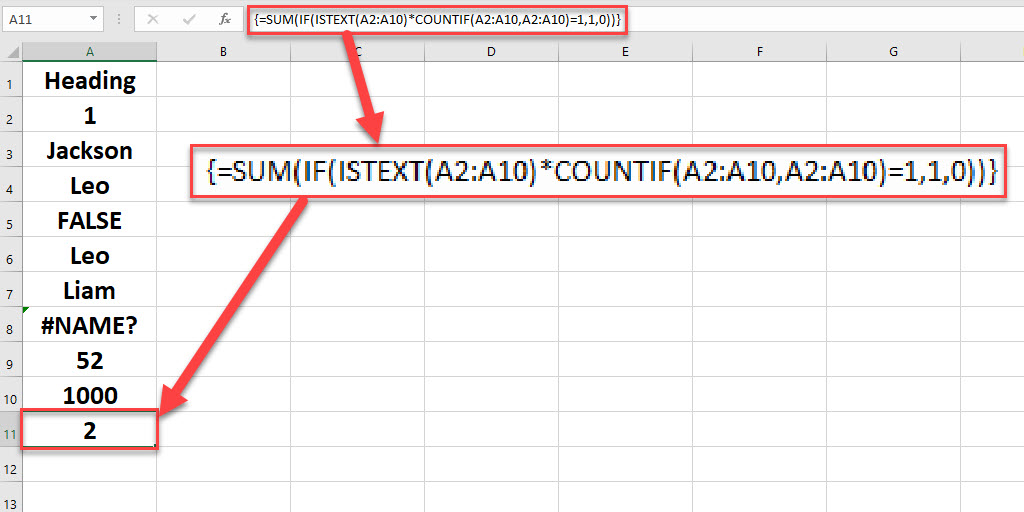
Count Unique Text Values
We count Unique text values by this array.
=SUM(IF(ISTEXT(data range)*COUNTIF( data range, data range)=1,1,0)))
Point: After you enter the array, you must press Shift+Ctrl+Enter.
This formula doesn’t count empty cells, numbers, logical values and errors.
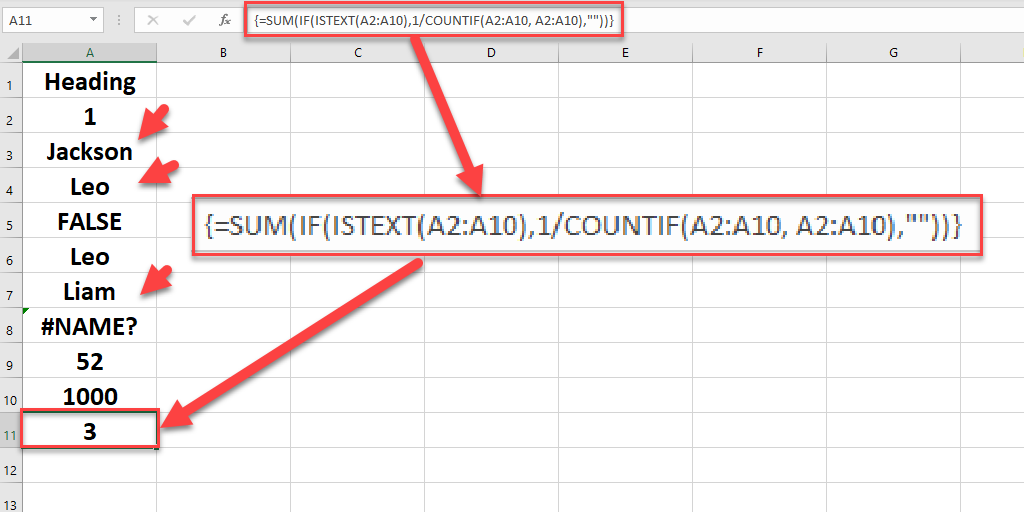
Count Distinct Text Values
We count Distinct text values by this array.
=SUM(IF(ISTEXT(range),1/COUNTIF(range, range),””))
Point: After entering the array, you must press Shift+Ctrl+Enter.
Note that this formula doesn’t count empty cells, numbers, logical values, and errors.
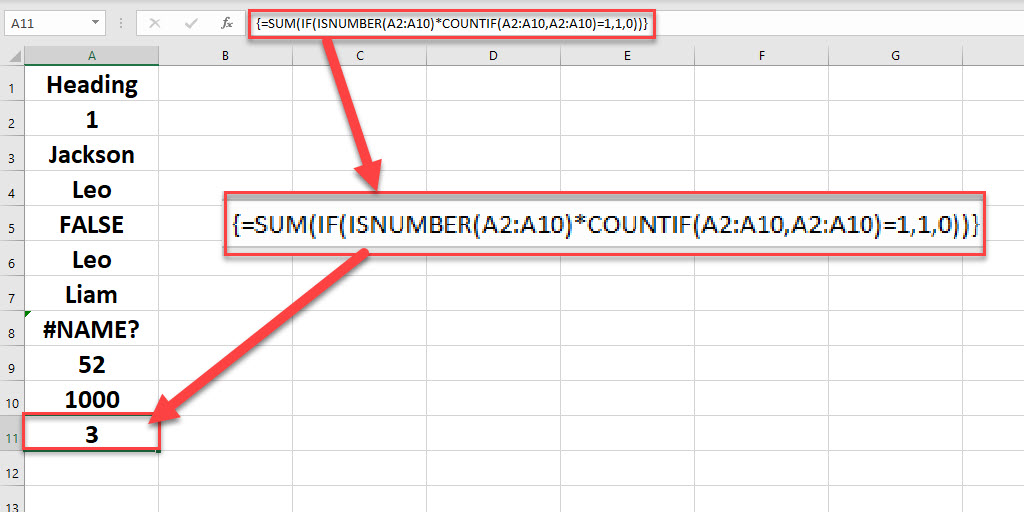
Count Unique Numerical Values
We count these values in a mixed data set by this array. This array formula is similar to the previous one, but we use the ISNUMBER function.
=SUM(IF(ISNUMBER(data range)*COUNTIF( data range, data range)=1,1,0)))
Point: After you enter the array, you must press Shift+Ctrl+Enter.
This formula doesn’t count empty cells, text, logical values and errors.
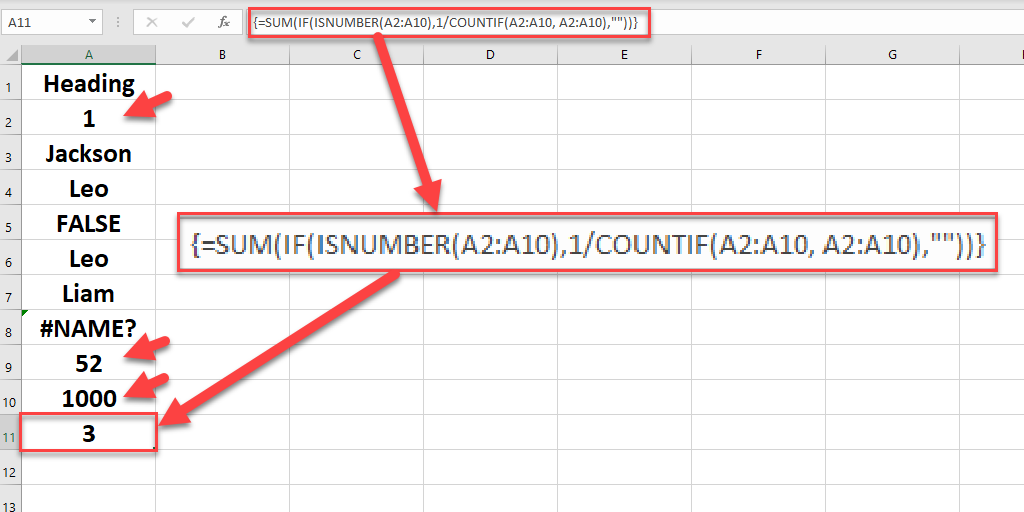
Count Distinct Numerical Values
We can count the values in a mixed data set by the following array. This array formula is similar to the previous one except for the ISNUMBER function.
=SUM(IF(ISNUMBER(range),1/COUNTIF(range, range),””))
Point: After entering the array, you must press Shift+Ctrl+Enter.
Again, note that this formula doesn’t count empty cells, text, logical values, and errors.
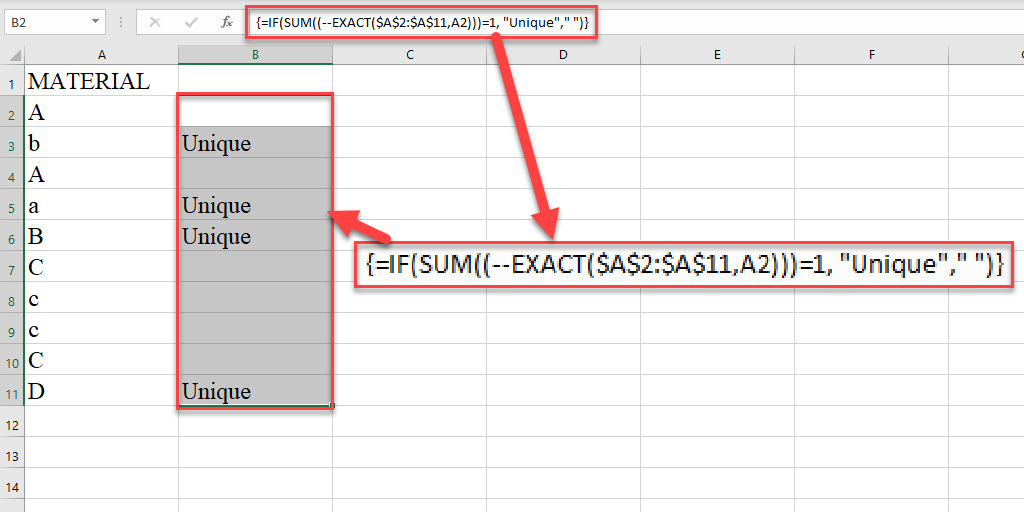
How to Count Unique and Distinct Values With Case Sensitivity?
In some data sets, values may have capital letters which makes them different from other values. For example, assume a list of materials. Type a on this list is different from type A. To count unique values in this data set, we use these formulas.
- To show which values in your data set are Unique, use this formula in a new column.
=IF(SUM(–EXACT($data rang$, first value)))=1, “Unique”, “”)
Point: After you enter the array, you must press Shift+Ctrl+Enter.
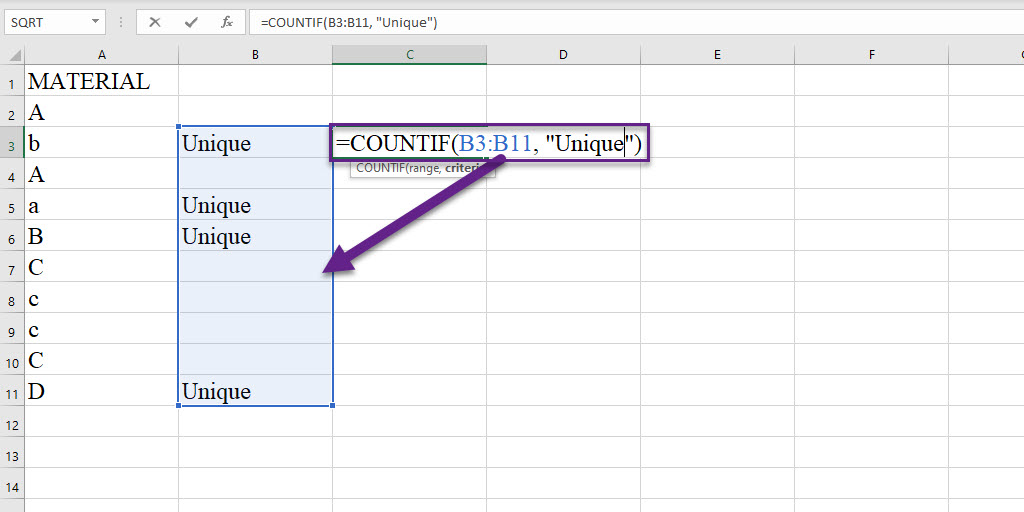
- Select an empty cell and enter this formula to count the Unique ones.
=COUNTIF(the newly formed column, “Unique”)
The formula to count Distinct values by this method is the same as the Unique values formula, except that there is a slight difference in the cell address:
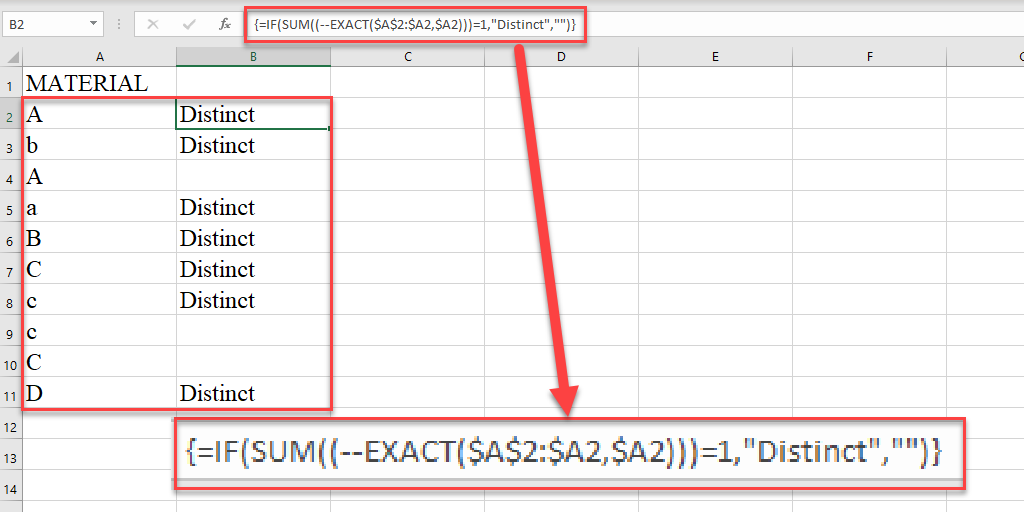
- To show which values are Distinct in your data set, use this formula in a new column.
=IF(SUM((–EXACT($A$2:$A2,$A2)))=1,”Distinct”,””)
Point: After entering the array, you must press Shift+Ctrl+Enter.
A2 is the first value in our example. Pay attention to the dollar signs.
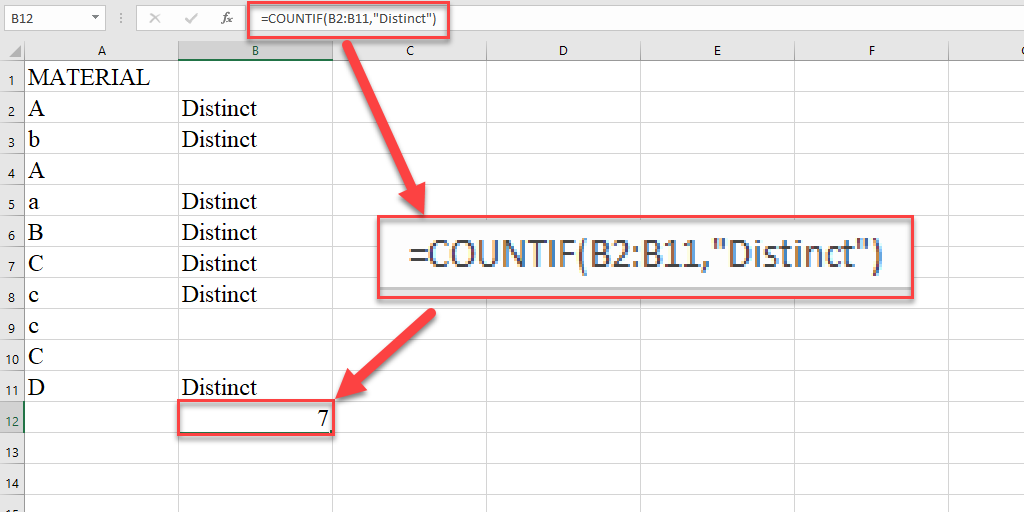
- Select an empty cell and enter this formula to count the Distinct ones.
=COUNTIF(the newly formed column, “Distinct”)
In this blog, we learned what Distinct and Unique values are and how to show and count them in a data list by the conditional formatting, CountIf formula, and Sum&If formula. If you need more help with counting formulas, visit Excel Count Functions.
You can connect with us, ask our experts if you have any inquiries and get more support via Excel Support Services.
Also, reduce costs, accelerate tasks, and improve quality with Excel Automation Services.
Our experts will be glad to help you, If this article didn’t answer your questions. ASK NOW
We believe this content can enhance our services. Yet, it’s awaiting comprehensive review. Your suggestions for improvement are invaluable. Kindly report any issue or suggestion using the “Report an issue” button below. We value your input.


