Optimize Inventory Management: Excel Solutions for Canadian Retailers
- The Significance of Inventory Management
- Setting Up Your Excel Inventory System
- Inventory Tracking in Excel and Recording
- Reorder Point and Safety Stock Calculation
- Sales Forecasting and Demand Planning
- Supplier Management and Ordering
- Stock Valuation and Cost of Goods Sold (COGS)
- Inventory Turnover Analysis
- DeadStock Identification and Reduction
- Inventory Reporting and Data Visualization
- Inventory Auditing and Cycle Counts
- Conclusion
- FAQ
In this article, we delve into the critical facets of efficient retail inventory management in Excel, offering practical insights and step-by-step guidance on leveraging Excel to ensure product availability, control costs, and maximize profits. From setting up your Excel inventory system to integrating with Point of Sale (POS) systems for real-time updates, each section is crafted to empower retailers in optimizing their operations and achieving success in the competitive retail landscape.
The Significance of Inventory Management
Retail inventory management in Excel is a vital success factor for Canadian retailers, ensuring product availability, reducing costs, and maximizing profits. Meeting customer demand consistently fosters trust and prevents lost sales, contributing to a positive shopping experience.
Here’s why it’s so important:
- Strategic prevention of stockouts minimizes the risk of customers seeking alternatives when desired products are unavailable.
- Effective inventory management directly impacts a retailer’s bottom line by reducing carrying costs.
- Striking the right balance in stock levels minimizes holding costs associated with storage, insurance, and potential obsolescence. Optimizing the ordering process ensures efficient resource use, improving operational efficiency and profitability.
- Maximizing profits in retail involves a holistic approach to inventory management. Retailers can optimize pricing strategies based on demand patterns, avoiding unnecessary markdowns.
- Advanced forecasting and robust tracking systems enhance supply chain visibility, enabling informed decisions that boost cash flow and overall profitability.
Setting Up Your Excel Inventory System
Creating a Retail Inventory Management in an Excel system involves essential steps for functionality and user-friendliness. Initial considerations encompass defining objectives and requirements, planning data organization, and setting naming conventions:
- Define Objectives and Requirements
Clearly outline system objectives and required functionalities, specifying data to be tracked (e.g., product names, quantities).
- Plan Data Organization
Design sheets with fields like product name and quantity, considering separate sheets for distinct data types.
- Set Naming Conventions
Establish clear, consistent naming conventions for sheets and columns to enhance clarity and navigation.
- Design Data Entry Forms
Create user-friendly entry forms with labeled fields, employing data validation and drop-down lists for accuracy.
- Implement Data Validation
Apply rules to prevent incorrect data entry, utilizing conditional formatting to highlight errors or low inventory levels.
- Consider File Structure
Organize files logically, creating folders for data, forms, and supporting documents. Use version control for clarity.
- Backup and Security Measures
Regularly backup files and implement security measures like password protection for sensitive data.
Inventory Tracking in Excel and Recording
Here’s a step-by-step guide on Inventory tracking in Excel:
1. Create a New Excel Workbook:
Open Excel and create a new worksheet.
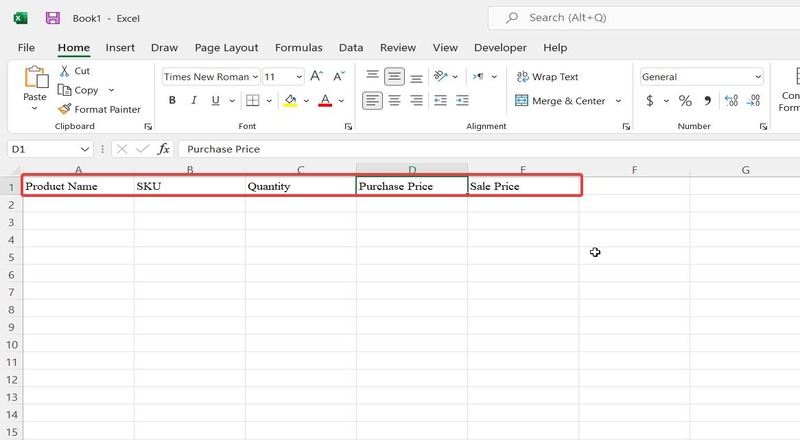
2. Organize Data:
Label the columns for essential information such as “Product Name,” “SKU,” “Quantity,” “Purchase Price,” and “Sale Price.”
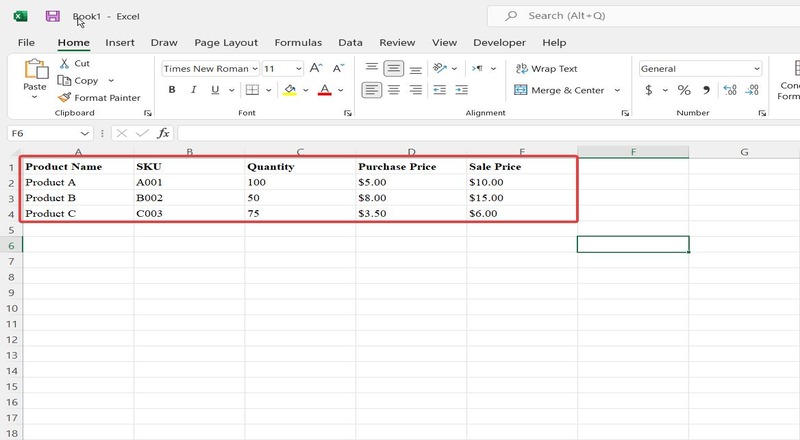
3. Enter Data:
Begin entering your inventory data row by row. Input product names, SKUs, current quantities, purchase prices, and sale prices in the respective columns.
4. Data Validation:
Use data validation to ensure accuracy in inventory control in retail. For example, set rules to allow only numerical values in quantity columns or specific formats for SKUs.
5. Formulas for Calculations:
Utilize Excel formulas for inventory management for automatic calculations. For example, use a formula like =Quantity * Purchase Price to calculate the total cost of your inventory.
6. Conditional Formatting:
Apply conditional formatting to highlight specific data points. For instance, set up rules to highlight low quantities or products with low-profit margins.
7. Sorting and Filtering:
Use the sorting and filtering features to organize and analyze your data easily. You can sort products alphabetically, by quantity, or by profit margin.
8. PivotTables for Analysis:
Create PivotTables to analyze your inventory data dynamically. This is especially useful for summarizing data by categories like product type or supplier.
9. Graphs and Charts:
Visualize your inventory data using graphs and charts. Bar charts can show quantities on hand, and line charts can illustrate price trends over time.
10. Templates for Inventory Tracking:
Excel provides various templates that can serve as a starting point for inventory tracking.
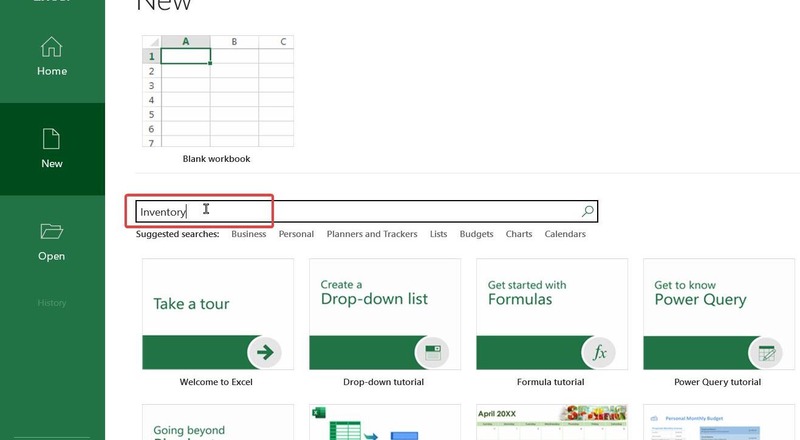
To access Excel templates for retail inventory, open Excel.
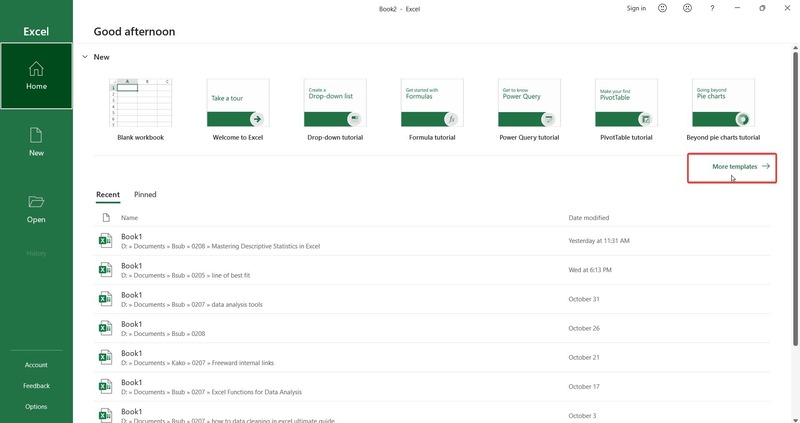
Search for “Inventory” in the template gallery.
Reorder Point and Safety Stock Calculation
To start Reorder Point and Safety Stock Calculation for Retail Inventory Management in Excel you first need to be familiar with these concepts:
Reorder Point: The inventory level prompting a new order to prevent stockouts, calculated based on lead time and daily demand.
Safety Stock: Extra inventory held to counter unexpected demand or lead time variations, determined by multiplying maximum daily demand by a safety factor (usually between 1.5 and 3.0).
How to calculate the reorder points and safety stock in Excel
To calculate the reorder point and safety stock for a product in Excel, you can use the following formulas:
Reorder point = Lead time * Daily demand
Safety stock = Maximum daily demand * Safety factor
For example, let’s say you have a product with a lead time of 2 days and a daily demand of 10 units. You would calculate the reorder point as follows:
Reorder point = 2 days * 10 units = 20 units
You would also calculate the safety stock as follows:
Safety stock = 15 units * 2.0 = 30 units
This means that you should place a new order for the product when your inventory level reaches 20 units. You should also keep at least 30 units of the product on hand as safety stock.
Sales Forecasting and Demand Planning
Sales forecasting and demand planning in retail inventory management in Excel is important for different reasons, including:
Optimizing Inventory Levels
- Sales forecasting aligns inventory with predicted demand.
- Prevents stockouts or overstock, optimizing inventory management.
Cost Reduction
- Accurate sales forecasting minimizes excess inventory.
- Reduces holding costs (storage, insurance, obsolescence).
- Efficient demand planning avoids unnecessary expenses in ordering.
Enhancing Customer Satisfaction
- Anticipating customer demand ensures product availability.
- A proactive approach prevents customer dissatisfaction.
Improved Supplier Relationships
- Sales forecasting enhances communication with suppliers.
- A clear understanding of future demand facilitates effective collaboration.
- Ensures timely deliveries and maintains smooth supply chains.
Strategic Decision-Making
- Accurate demand planning in inventory tracking in Excel informs strategic decisions.
- Enables adjustments in pricing, marketing, and resource allocation.
- Contributes to overall business success.
Excel-based demand forecasting Capabilities
Excel has a number of capabilities for demand forecasting, including:
- Organizing Data
Input historical sales data into Excel with organized columns for dates and corresponding sales figures.
- Create a Time Series Chart
Utilize Excel’s charting tools to visually represent historical sales data with a time series chart, providing insights into trends and patterns.
- Use Moving Averages
Implement Excel formulas for calculating moving averages to smooth data fluctuations, aiding in trend identification.
Excel-based demand forecasting Functions
Leverage Excel’s forecasting functions like FORECAST.ETS and FORECAST.LINEAR for quick and efficient predictions based on historical data.
- Regression Analysis
Utilize Excel’s support for regression analysis, fitting models to predict future sales based on relationships with relevant variables.
- Data Validation and Adjustments
Regularly validate and adjust forecasting models based on actual sales data, ensuring ongoing accuracy in dynamic market conditions.
- Scenario Analysis
Excel’s flexibility allows for scenario analysis, enabling users to create multiple forecasts based on different assumptions, which is crucial for managing market uncertainties.
- Integrate with Inventory Management
Seamlessly integrate demand forecasts into the inventory management system, ensuring optimal stock levels aligned with anticipated demand, thereby reducing carrying costs.
Supplier Management and Ordering
Excel is instrumental in supplier management and order placement with its versatile features. Users can organize supplier details, track lead times, and maintain order history in structured sheets, facilitating efficient communication and decision-making.
Standardized purchase order templates minimize errors, while conditional formatting provides timely alerts for reorder points and deviations. Supplier evaluation scorecards aid in performance assessment.
Excel serves as a centralized platform for streamlined information tracking, ensuring effective retail inventory management in Excel and informed decision-making in procurement.
Excel tools for tracking supplier contacts
- Supplier directory: Create a supplier directory to track supplier contact information, such as names, phone numbers, email addresses, and website addresses.
- Supplier contact log: Create a supplier contact log to track your interactions with each supplier, such as meeting notes, phone call summaries, and email conversations.
Excel tools for tracking lead times
- Lead time tracker: Create a lead time tracker to track the average lead time for each supplier. This information can be used to ensure that orders are placed in time to avoid stockouts.
- Lead time dashboard: Create a lead time dashboard to visualize the lead times for all of your suppliers. This can help you to identify suppliers with long lead times and to take steps to reduce lead times.
Excel tools for tracking order history
- Order history tracker: Create an order history tracker to track all of your orders with each supplier. This information can be used to track order status, identify trends, and generate reports.
- Purchase order generator: Create a purchase order generator to create and send purchase orders to suppliers. This can automate the order placement process and save time.
Stock Valuation and Cost of Goods Sold (COGS)
Stock valuation and cost of goods sold (COGS) are two important concepts in retail inventory management in Excel. Stock valuation is the process of determining the value of a company’s inventory on hand.
COGS is the cost of the goods that have been sold during a period. Both stock valuation and COGS are important for financial reporting and decision-making.
How Excel can help calculate the value of inventory tracking in Excel on hand and the COGS
1. FIFO (First In, First Out) Method:
· Use Excel formulas, such as SUMPRODUCT, to calculate the total value of inventory on hand. Sort your data based on the dates of purchase and apply the FIFO method to ensure the cost of the earliest purchased items is considered first.
=SUMPRODUCT(B2:B100, C2:C100) // Where B is the quantity column and C is the purchase price column.
2. COGS Calculation with FIFO:
· Calculate the COGS by summing the product of quantities sold and their corresponding purchase prices. Subtract this value from the initial inventory value to get the remaining inventory value.
=SUMPRODUCT(D2:D100, C2:C100) // Where D is the quantity sold column
3. Average Cost Method:
· For an average cost method, calculate the average cost per unit by dividing the total cost by the total quantity.
=SUMPRODUCT(B2:B100, C2:C100)/SUM(B2:B100) // Where B is the quantity column.
Excel formulas and methods for accurate valuation
Here are some Excel formulas and methods for accurate valuation:
Formulas
- Weighted average cost (WAC): This method calculates the average cost of goods sold by taking the average of the cost of goods purchased during the period.
WAC = (Beginning inventory cost + Purchases cost) / (Beginning inventory quantity + Purchases quantity)
- First-in, first-out (FIFO): This method assumes that the first goods purchased are the first goods sold.
FIFO = (Beginning inventory quantity * Beginning inventory cost) + (Purchases quantity * Purchases cost) – (Ending inventory quantity * Ending inventory cost)
- Last-in, first-out (LIFO): This method assumes that the last goods purchased are the first goods sold.
LIFO = (Ending inventory quantity * Ending inventory cost) + (Purchases quantity * Purchases cost) – (Beginning inventory quantity * Beginning inventory cost)
Methods
- Physical inventory count: This is the most accurate method of inventory valuation, but it can also be the most time-consuming. To conduct a physical inventory count, you need to count all of the inventory on hand at a specific point in time.
- Perpetual inventory system: This is a system that tracks inventory levels in real time. When inventory is purchased or sold, the system updates the inventory levels accordingly.
Perpetual inventory systems are more accurate than physical inventory counts, but they can also be more complex to implement and maintain.
- Inventory sampling: This is a method of inventory valuation that involves counting a sample of the inventory on hand. The results of the sample are then used to estimate the total value of the retail inventory tracking system.
Inventory sampling is a good option for businesses with a large volume of inventory or for businesses that need to value their inventory frequently.
Inventory Turnover Analysis
Inventory turnover is a crucial financial metric that measures how many times a company’s inventory is sold and replaced over a specific period. It is calculated by dividing the cost of goods sold (COGS) by the average inventory during the same period. The formula is:
Inventory turnover = COGS / Average inventory value
The relevance of inventory control in retail businesses lies in its ability to provide insights into the efficiency of their inventory management.
A high inventory turnover suggests that products are selling quickly, indicating good sales and demand responsiveness.
Retail businesses typically have a high volume of inventory and a relatively short product life cycle. This means that it is important for retail businesses to sell their inventory quickly before it becomes obsolete. stocking, slow-moving inventory, or inadequate sales.
How to use Excel to analyze inventory turnover rates
Here is an example of how to use Excel to analyze inventory turnover rates and make informed decisions:
Imagine that you are the owner of a retail clothing store. You have collected the following data for the past year:
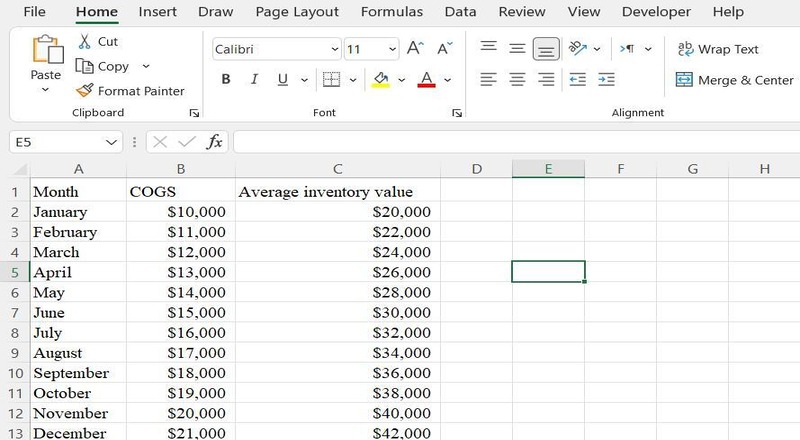
To calculate the inventory turnover rate for each month, you would use the following formula:
Inventory turnover = COGS / Average inventory value
For example, the inventory turnover rate for January would be:
Inventory turnover = $10,000 / $20,000 = 0.5
This means that you sold your inventory 0.5 times in January.
DeadStock Identification and Reduction
Deadstock, also known as slow-moving inventory, is inventory that does not sell well or does not sell at all. It can be a major financial burden for businesses, as it ties up cash and can lead to increased costs.
Challenges of dead or slow-moving inventory
Dead or slow-moving inventory presents a number of challenges for businesses, including:
- Reduced cash flow: Dead or slow-moving inventory ties up cash that could be used for other purposes, such as investing in new products, expanding into new markets, or hiring new employees.
- Increased costs: Dead or slow-moving inventory can increase costs in a number of ways, such as:
- Storage costs: Businesses need to pay to store dead or slow-moving inventory, which can add up over time.
- Obsolescence costs: Dead or slow-moving inventory may become obsolete, meaning that it can no longer be sold at full price or may even be worthless.
- Markdown costs: Businesses often need to mark down dead or slow-moving inventory in order to sell it, which reduces their profit margins.
- Damage and loss: Dead or slow-moving inventory is more likely to be damaged or lost than inventory that is selling quickly.
- Reduced customer satisfaction: Dead or slow-moving inventory can lead to reduced customer satisfaction if customers cannot find the products they are looking for.
Excel techniques for identifying and reducing dead stock to optimize cash flow
Excel can be used to identify and reduce dead stock in a number of ways.
Identifying dead stock
- Inventory tracking in Excel levels: Excel can be used to track inventory levels over time. This information can be used to identify products that are not selling well.
- Calculate inventory turnover rates: The inventory turnover rate is a measure of how quickly a business sells its inventory. A lower inventory turnover rate indicates that a business has more dead stock.
- Analyze sales data: Excel can be used to analyze sales data to identify products that are not selling well.
- Compare sales to inventory levels: Excel can be used to compare sales to inventory levels to identify products that are not selling well.
Reducing dead stock
- Mark down prices: One way to reduce dead stock is to mark down prices. This can encourage customers to purchase the products and can also help to free up cash flow.
- Offer discounts: Businesses can also offer discounts on dead or slow-moving inventory to encourage customers to purchase the products.
- Run promotions: Businesses can also run promotions on dead or slow-moving inventory to encourage customers to purchase the products.
- Sell excess inventory to other businesses: Businesses can also sell excess inventory to other businesses that may be interested in the products.
- Discard obsolete inventory: Businesses may need to discard obsolete inventory if it is no longer salable.
Inventory Reporting and Data Visualization
Clear inventory reports are essential for businesses, offering insights into inventory levels, sales trends, and key metrics. They provide a foundation for informed decision-making in areas like inventory management, pricing, and marketing.
Improved visibility helps businesses identify potential stockouts or overstock situations, enabling proactive adjustments for optimal stock levels. These reports contribute significantly to decision-making, allowing businesses to make informed choices about inventory practices, pricing, and marketing campaigns.
For instance, by identifying slow-moving items, businesses can implement targeted measures to optimize inventory. Moreover, the impact extends to increased profitability by strategically reducing costs, improving sales, and identifying high-demand products for more frequent restocking.
Excel’s charting and graphing capabilities for visualizing inventory data
Excel offers a variety of charting and graphing capabilities that can be used to visualize inventory data. This can help businesses to identify trends and patterns in their data and to make more informed decisions.
Here are some examples of how Excel’s charting and graphing capabilities can be used to visualize inventory data:
- Column Charts for Quantity Levels
Use Excel’s column charts to visually represent the quantities of different products in your retail inventory management in Excel. This provides a quick overview of stock levels and identifies items that may need attention.
- Line Charts for Inventory Trends
Create line charts to display inventory trends over time. This helps businesses understand patterns, seasonality, and fluctuations in demand, facilitating better forecasting and decision-making.
- Pie Charts for Product Contribution
Utilize pie charts to showcase the contribution of each product to the total inventory. This visual representation helps identify high-impact products and allocate resources accordingly.
- Gauge Charts for Reorder Points
Gauge charts in Excel can effectively visualize reorder points for different products. This enables quick identification of items approaching depletion and in need of reordering.
Inventory Auditing and Cycle Counts
Inventory audits and cycle counts are essential processes for ensuring that inventory records are accurate and that inventory is properly managed.
Inventory audits are full counts of all inventory on hand. They are typically conducted at least once a year but may be conducted more frequently if necessary.
Cycle counts are partial counts of inventory. They are typically conducted on a regular basis, such as weekly or monthly. Cycle counts can be used to identify and correct inventory discrepancies before they become too large.
Regular inventory audits and cycle counts are crucial to maintaining accurate records, addressing errors from data entry and preventing discrepancies due to theft or other factors.
Beyond accuracy, these processes help businesses identify slow-moving and obsolete inventory, informing strategic decisions on allocation and product offerings. Furthermore, by addressing issues related to theft or damage, these audits play a vital role in preventing inventory shrinkage.
Compliance with financial regulations also underscores the importance of regular inventory audits for businesses, ensuring transparency and meeting regulatory requirements.
Using Excel for conducting audits and reconciling discrepancies
Excel can be a valuable tool for conducting inventory audits and reconciling discrepancies. Here are some tips:
1. Create a spreadsheet to track your inventory data. This spreadsheet should include columns for the following information:
- Product code
- Product description
- Unit of measure
- Quantity on hand
- Audited quantity
- Variance
2. Use Excel formulas to calculate the variance. The variance is the difference between the quantity on hand and the audited quantity.
3. Use Excel filters to identify inventory discrepancies. You can use Excel filters to identify inventory discrepancies based on product code, product description, unit of measure, quantity on hand, audited quantity, or variance.
4. Use Excel charts and graphs to visualize inventory discrepancies. This can help you to identify trends and patterns in the discrepancies.
5. Use Excel pivot tables to summarize inventory discrepancies. This can help you to quickly identify the products with the largest variances.
Once you have identified inventory discrepancies, you can leverage Excel for Retail Inventory Management in Excel to reconcile them. This may involve adjusting inventory records, investigating the cause of the discrepancies, or taking other corrective action.
Integration with Point of Sale (POS) Systems
Excel can be integrated with POS systems for real-time inventory updates in a number of ways. One common method is to use a third-party integration tool. These tools provide a bridge between Excel and the POS system, allowing data to be transferred automatically.
Once Excel is integrated with the POS system, real-time inventory updates can be achieved by automatically transferring sales data from the POS system to Excel. This can be done using a variety of methods, such as:
- Scheduled data transfers: Data can be transferred from the POS system to Excel on a scheduled basis, such as every hour or every day.
- Event-driven data transfers: Data can be transferred from the POS system to Excel whenever a certain event occurs, such as a sale or a return.
- Real-time data transfers: Data can be transferred from the POS system to Excel in real time, as it is generated.
The best method for automating data transfer between Excel and the POS system will depend on the specific needs of the business. However, all of these methods can be used to achieve real-time inventory tracking in Excel updates.
Tips for automating data transfer between Excel and the POS system
Here are some tips for automating data transfer between Excel and the POS system:
- Use a third-party integration tool or the POS system’s API to integrate Excel with the POS system.
- Choose a method for data transfer that is appropriate for the needs of the business.
- Schedule data transfers regularly to ensure that inventory records are always up to date.
- Test the data transfer process to ensure that it is working properly.
- Monitor the data transfer process on a regular basis to identify any problems.
By following these tips, businesses can automate data transfer between Excel and the POS system to achieve real-time inventory updates. This can help businesses to improve inventory management, reduce costs, and increase profits.
For actionable tips and a deeper dive into essential Excel functions and templates for inventory tracking, check out our detailed guide on Excel inventory management tips, functions, and templates.
Conclusion
In conclusion, Retail Inventory Management in Excel serves as a pivotal tool for Canadian retailers seeking to optimize product availability, minimize carrying costs, and maximize profits.
The comprehensive guide provided covers crucial aspects of inventory management, from setting up Excel-based systems and tracking inventory to calculating reorder points, forecasting sales, and managing suppliers. The integration of Excel with Point of Sale (POS) systems for real-time updates underscores the adaptability of this platform to modern retail needs.
By utilizing Excel’s functionalities, retailers can enhance efficiency in supplier management, valuation calculations, inventory turnover analysis, and dead stock reduction.
The importance of clear inventory reporting and data visualization is emphasized, showcasing Excel’s charting capabilities for enhanced decision-making. Moreover, the guide highlights the significance of regular inventory audits and cycle counts, providing valuable insights into maintaining accuracy and compliance.
We’re eager to hear about your experiences and insights into using Excel for inventory management in your retail endeavors. Whether you seek further guidance or wish to share your success stories, our virtual doors are open. Reach out, connect, and let’s elevate your retail operations together. Your journey to Excel-driven inventory excellence begins now!
Now that you’ve learned strategies to optimize inventory management, it’s time to get started with building your own inventory list. Check out this step-by-step guide to create an efficient inventory list in Excel.
FAQ
Retail inventory management faces challenges such as demand forecasting, stockouts, supplier coordination, dead stock, data accuracy, and manual processes. Excel offers solutions through its data analysis tools, real-time updates, automated calculations, and alert systems.
It aids in supplier management by organizing databases and facilitating data transfer. Excel’s analytical tools assist in identifying slow-moving and obsolete stock, and its data validation features ensure accuracy. Automation features reduce manual efforts in tasks like data entry and report generation. Overall, Excel enhances efficiency and addresses key challenges in retail inventory management by providing tailored solutions to meet specific needs.
Excel facilitates accurate tracking and updating of inventory levels through various features. It organizes data efficiently, supports real-time updates from external sources, and automates calculations with formulas.
Conditional formatting visually highlights low stock levels, while barcode scanning streamlines data entry. Data validation ensures accuracy, and pivot tables enable dynamic analysis. Historical tracking and visual representations through graphs aid trend analysis.
Excel’s integration capabilities with other systems ensure that inventory levels reflect real-time changes, providing businesses with a versatile and powerful tool for effective inventory management.
Excel serves as a powerful tool for analyzing inventory turnover and identifying slow-moving items. Businesses can utilize data analysis tools, such as pivot tables and charts, to visualize trends and patterns related to inventory turnover.
Excel allows for the calculation of turnover ratios, and its conditional formatting features highlight items with low turnover rates. The platform supports ABC analysis, sorting, and filtering to prioritize attention and identify slow-moving items.
Historical trend analysis, along with alerts and notifications, ensures a proactive approach to managing inventory. Data validation features maintain accuracy, and integration with POS systems provides real-time updates for precise analysis.
Excel’s graphing and reporting capabilities facilitate clear communication of findings and insights, empowering businesses to optimize their inventory management strategies effectively.
Our experts will be glad to help you, If this article didn’t answer your questions. ASK NOW
We believe this content can enhance our services. Yet, it’s awaiting comprehensive review. Your suggestions for improvement are invaluable. Kindly report any issue or suggestion using the “Report an issue” button below. We value your input.


