Transform Financial Analysis with Microsoft Excel
Our Excel financial modelling services are here to take your financial planning to the next level. We help you gain clarity, precision, and control over your key financial data so that you make wise decisions. Let us resolve your financial modelling complexity so you can move your business forward.
Our Services
Customize workflows using our tailored Excel solutions. Let us enhance your Excel task:
Excel Automation
We automate repetitive tasks and complex workflows, laying off manual errors, and giving back time. Our automation services enable your team to focus on strategic, high-value activities.
Excel Add-Ins
We develop user-friendly, tailor-made add-ins that make workflow smooth and easy. We also improve efficiency, empowering your team to do more on Excel.
Data Visualization In Excel
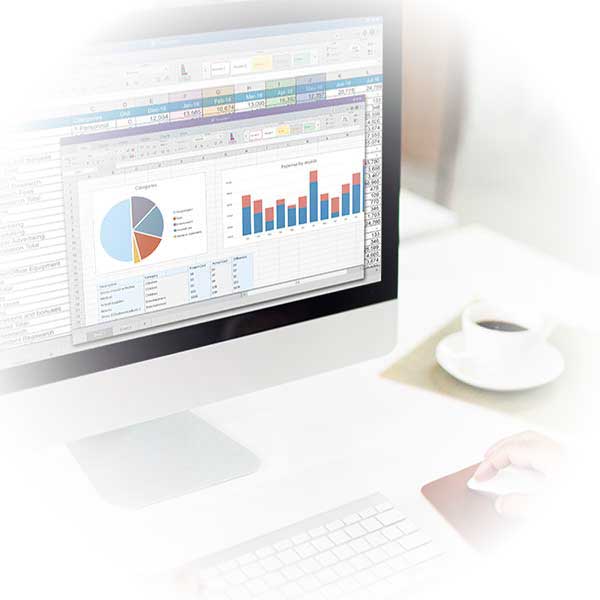
We will make dynamic, easy-to-understand charts and dashboards that allow you to see trends and patterns inside it. You can see real insight into your data with a process of informed decision-making.
Excel Programming And Development
This is the way our well-trained developers come up with solid and innovative solutions through consistent macros, VBA scripts, and sophisticated functions. We can change the way you’re working in Excel.
Excel Expert Help
Our experts will help you with quick solutions, valuable tips, and in-depth support to use Excel optimally for your business requirements.
Excel Financial Modeling Services
Our experienced team specializes in creating robust and insightful financial models using Excel. With precise calculations and detailed scenario analyses, we empower you to make data-driven decisions confidently.
How Excel Can Benefit Financial Analysis and Reporting
Even with all of the new tech available, Microsoft Excel is still a need in financial reporting. Its flexibility and power make it ideal for data manipulation and the compilation of comprehensive financial statements. You can easily prepare the cash flow statements and visualize them using charts. The growing number of Excel tips shows how flexible and user-friendly this program is.
Our Clients


Excel Tools and Features for Finance
Excel has several tools and functions that enable you to keep records of your finances and perform price analyses. They include the following:
Tailored Solutions for Financial Institutions
In the following Excel solutions, you can optimize most of your financial processes, including:
Core Financials
Our Excel services help you run your business with a cloud accounting solution. You can run your core financials from anywhere using cloud integration that assures your safety of data and its constant availability.
Accounts Payable
Payment automation in your Excel can save you thousands of hours. It helps you avoid inefficient workflows to save time and reduce errors to ensure accurate and timely payments.
Reporting & Dashboards
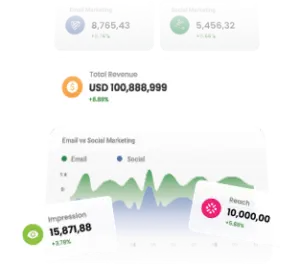
Excel allows you to create world-class financial reports and dashboards. You can reduce the time spent checking data accuracy and reporting. Some of the powerful features within Excel will enable you to quickly and easily create detail-rich reports and eye-catching dashboards.
Order Management
Excel has an order management module that helps in smoothing out one of the complex quote-to-cash processes. The process simplifies managing high volumes of orders with complex processing and inventory challenges.

Why Choose Excel for Financial Analysis
Microsoft Excel software is a very powerful spreadsheet program that has numerous benefits in uses for everyone:
what our clients say about BSuite365?

I have been working with BSuite365 team on various projects over the last 4 years. It started with a complex mathematical problem and a simple spreadsheet. Their team always surprises me with their skills and passion for their work. They really work hard to ensure projects meet the business criteria and solve the business problems they need to. I will continue working with them to improve the business systems of our company.

Working with Sajad and his team at BSuite365 has been an easy and pleasant experience. The solution they built for us will save us dozens of hours of labour costs several times a year and has been well worth what we paid. I can easily recommend them and will not hesitate to work with them again in the future.

Sajad and his team have been extremely helpful in meeting our website needs. They listen to what your vision is and not only work around it, but help to flesh it out. I would highly recommend Sajad and BSuite365 to anyone with Technology needs.

At Persephone Brewing we utilize a number of systems to manage and report our data. BSuite365 System helped us streamline these processes by automating several business processes using our existing data sets saving us hundreds of hours a year at a very reasonable cost.
Excel for Specific Financial Tasks
Specialized Excel features and tools finance professionals use to enable a significant transformation of finance operations.
Scenario Modelling Tool
With Excel’s Scenario Modelling Tool, you will be ready for any financial situation. With this feature, you can see how different changes can impact your overall finances. This is the best module to plan and estimate risks and make a wise choice for your next step, by visualizing possible outcomes.
Excel Add-ins
Excel integrates seamlessly with tech software, databases, and project management tools. Import and export data easily between systems, ensuring smooth workflows. Use Excel to consolidate information from various sources into one accessible place. Enhance your tech operations with streamlined data management.
Native Excel Platform
We can help you run your spreadsheets with the power of a native Excel platform for FP&A. This setup enhances the capabilities of Excel with the addition of customized FP&A tools. You can build robust financial models, automate tasks for your data, and conduct better analysis within Excel.
FP&A Tools for CFOs
Our services help you keep your financial Excel models current, and automate repetitive tasks with these FP&A tools for CFOs. These features make financial planning, budgeting, and forecasting much easier and more accurate. They are integrated with Excel, and you will distribute them flexibly and efficiently.


