Excel Tips for HR: Streamlining Recruitment, Payroll, and Performance Tracking
Managing HR tasks can often feel overwhelming. Whether you’re running a large or small business, it’s essential to have a reliable resource for handling data-intensive duties. Utilizing the right tools can simplify this process, and fortunately, Excel is a great option.
Excel significantly transforms HR processes by enabling effective management of tasks such as recruitment, payroll, and performance tracking through its wide range of features.
In this post, we will explore how to maximize the potential of Excel for HR management. From recruitment tracking to performance dashboards, we will provide practical tips and tricks for each major HR function.
Excel Tips for Streamlining Recruitment
Recruitment involves handling large amounts of data, from tracking candidates to scheduling interviews and evaluating skills. Excel is a powerful tool to streamline these tasks, saving time and ensuring accuracy. Here are some effective ways to use Excel for recruitment management:
1. Creating Candidate Databases
Excel tables are an excellent way to organize candidate information in a structured format. You can set up columns for essential details like:
- Candidate Name (Full name of the candidate)
- Contact Information (Email address, phone number, etc.)
- Qualifications (Degrees, certifications, and other relevant qualifications)
- Experience (Years of experience, previous roles, and key skills)
- Interview Date (Date of the interview)
- Interviewer (Name of the interviewer)
- Interview Notes (Notes from the interview)
- Current Status (status of the candidate (e.g., applied, interviewed, hired, rejected))
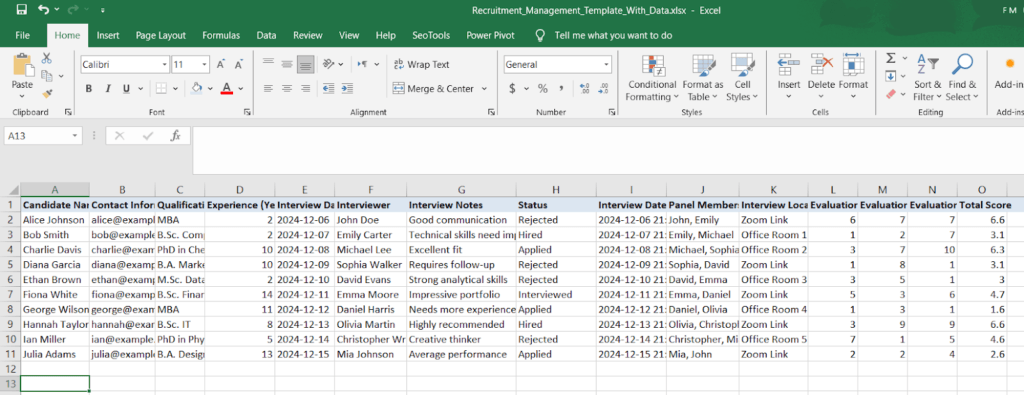
This approach allows you to quickly sort, filter, and search for candidates based on specific criteria, making it easy to manage a large pool of applicants. For example, you can filter to view only candidates with a specific certification or sort by experience level to prioritize evaluations.
2. Tracking Application Status
Tracking where each candidate stands in the recruitment process is critical to keeping the hiring pipeline organized. Excel’s conditional formatting and drop-down lists make this task straightforward.
- Step 1: Create a column for “Application Status” with a drop-down menu for statuses like “Applied,” “Interviewed,” “Hired,” or “Rejected.”
- Step 2: Use color-coded conditional formatting to visually represent the status. For instance:
- Green for “Hired”
- Yellow for “Interviewed”
- Red for “Rejected”
![]()
This system makes it easy to glance at your spreadsheet and see the overall progress of your recruitment efforts.
3. Using Excel Templates for Interview Scheduling
Interview scheduling can often be time-consuming, especially when coordinating availability across candidates and interviewers. Excel templates simplify this process by providing a clear framework to organize schedules.
Set up a template with:
- Candidate Name
- Interview Date and Time
- Panel Members
- Interview Location or Virtual Link
You can also add a column to track interviewer availability to ensure no scheduling conflicts.
4. Automating Candidate Evaluation Scores
Evaluating candidates fairly and efficiently is a key part of recruitment. With Excel, you can automate this process using simple scoring formulas.
Here’s how:
- Create a Scoring System: Assign weights to various criteria, such as qualifications, experience, and interview performance. For instance:
- Qualifications: 40%
- Experience: 30%
- Cultural Fit: 30%
- Use Formulas: Set up formulas to calculate the total score for each candidate based on their performance in each category. For example, use the SUMPRODUCT formula to combine scores with their assigned weights.
Excel Tips for Efficient Payroll Management
Payroll management is one of any HR organization’s most important and time-sensitive responsibilities. It requires precision, adherence to regulations, and precise reporting. With its sophisticated features and functionalities, Excel can streamline payroll operations, decrease errors, and save time.
Let’s look at how to accomplish payroll perfection with Excel.
1. Automated Payroll Calculations: Calculating with Confidence
Calculating payroll manually is not only time-consuming but also prone to errors. Excel’s formulas offer a reliable way to automate these calculations. Here’s how:
- Use basic arithmetic formulas for gross pay: =Hourly_Rate * Hours_Worked. (For example, if the hourly rate is in cell B2 and the hours worked are in C2, the formula would be: =B2*C2)
- Incorporate the IF function to handle deductions based on thresholds, such as tax brackets or benefit contributions.
- Calculate net pay by subtracting total deductions from gross pay: =Gross_Pay – Deductions.
This approach minimizes mistakes and ensures your payroll calculations are accurate every time. You can even create reusable templates, saving time for each payroll cycle.
2. Tracking Employee Hours and Overtime: Timely and Accurate Tracking
Tracking hours worked and identifying overtime can be simplified using Excel. To efficiently track employee hours and identify over time, follow these steps:
- Create a Timesheet Template:
- To effectively track employee hours and identify overtime, create a simple timesheet template in Excel. The spreadsheet with columns for:
- Date
- Start Time
- End Time
- Total Hours
- Overtime Hours
- Calculate Total Hours:
- Calculate total hours worked for a specific period, such as weekly or monthly, using formulas like =SUMIF
- For example, use this formula to compute daily work hours:
=(End Time – Start Time) * 24
Note:
- Format the result as a decimal to reflect hours accurately.
- Ensure time entries are formatted as “Time” in Excel for the formula to work correctly.
- Identify Overtime Hours:
- Conditional Formatting: Highlight cells exceeding a specific threshold (e.g., 40 hours per week) using conditional formatting.
- IF Function: Automatically calculate overtime:
=IF(Total_Hours>40, Total_Hours-40, 0) (This formula subtracts 40 from total hours if the threshold is exceeded.)
- Calculate Total Hours for a Specific Period:
- SUMIF Function: Use SUMIF to total hours for a specific employee or period:
=SUMIF(Employee_Name_Range, Employee_Name, Total_Hours_Range) - Pivot Tables: Create pivot tables to summarize employee hours by week, month, or other periods.
This setup ensures accurate payroll calculations and helps you monitor compliance with labor laws.
3. Using Excel for Tax and Benefits Calculations: Simplified Deductions
Taxes and benefits can complicate payroll processing, but Excel provides powerful tools to streamline tax and benefit calculations:
- Setting Up Tax Calculations
- Create a Tax Table:
- Set up a table with income ranges and corresponding tax rates.
- Use VLOOKUP or INDEX-MATCH functions to reference this table and determine the applicable tax rate for each employee’s income.
- Create a Tax Table:
- Calculate Federal Income Tax: Use this Excel formula to determine the gross pay in the tax table and return the corresponding tax rate.
=VLOOKUP(Gross_Pay, Tax_Table_Range, 2, TRUE)
- Calculate State Income Tax: Use a similar approach, referencing a state-specific tax table.
- Setting Up Benefit Deductions:
- Health Insurance: Calculate the employee’s contribution as a fixed amount or a percentage of their gross pay.
- Retirement Contributions: Calculate the employee’s contribution based on a fixed percentage of their salary: You can use this formula =Gross_Pay * Contribution_Rate
- Other Deductions: Use similar formulas to calculate deductions for other benefits like life insurance or dental plans.
By automating these calculations, you not only save time but also ensure compliance with tax regulations and internal policies.
4. Payroll Summaries and Reporting: Insights at Your Fingertips
Excel simplifies payroll reporting through pivot tables and summary sheets, offering clear insights into total costs, taxes, and benefits.
- Organize Data: Structure payroll data with columns for Gross Pay, Taxes, Benefits, Deductions, Net Pay, and Departments.
- Pivot Tables:
- Use pivot tables to summarize data by department, employee, or time period.
- Add fields like Gross Pay and Net Pay to calculate totals.
- Charts: Visualize trends in payroll costs using bar charts or line graphs.
- Monthly Summary: Use SUMIF or pivot tables to calculate and display totals for specific months.
- Automation: Use macros or templates to streamline report generation.
This approach delivers efficient and transparent payroll insights.
Excel Tips for Tracking Employee Performance
Tracking employee performance is essential for driving individual growth and organizational success. Excel, with its robust features, can help HR teams streamline performance evaluations, monitor key metrics, and gain actionable insights.
Here’s how to leverage Excel for performance tracking:
1. Setting Up Performance Dashboards: A Clear Vision of Success
A well-designed performance dashboard provides an instant snapshot of employee performance. For a detailed guide on creating powerful HR dashboards, visit Best HR Dashboards in Excel.
To create a performance dashboard, use pivot tables and charts to summarize key data points, such as sales numbers or project completion rates.
- Pivot Tables: Organize data by department or employee to show trends and comparisons.
- Charts: Use bar, line, or pie charts to visually represent performance metrics, making it easier to spot high and low performers.
2. Automating Performance Review Scores: Simplifying Evaluations
Manual score calculations during performance reviews can be time-consuming and prone to errors. To streamline performance review processes, you can create Excel templates to automate score calculations and generate comprehensive reports.
To streamline performance reviews in Excel:
- Create a Scoring Template: Define performance criteria (e.g., quality of work, teamwork) and assign weights to each.
- Use a Rating Scale: Rate each criterion on a scale (e.g., 1-5).
- Calculate Weighted Scores: Use the SUMPRODUCT formula to calculate the weighted average for each employee.
- Generate Reports: Create a summary sheet, use pivot tables for analysis, and visualize data with charts.
This automation saves time, ensures consistency, and improves the efficiency of performance reviews.
3. Tracking KPIs and Goals: Monitoring Progress with Ease
Keeping track of individual and team goals is critical for measuring success. Excel provides robust tools to monitor key performance indicators (KPIs) and assess goal progress. Here’s how to set up a spreadsheet effectively:
- Create a KPI Tracking Sheet:
- Define KPIs: Clearly identify the KPIs relevant to your team or organization.
- Set Goals: Establish specific, measurable, achievable, relevant, and time-bound (SMART) goals for each KPI.
- Track Progress: Create columns to record:
- Current Value
- Target Value
- Percentage Complete
- Visualize Progress with Charts and Graphs:
- Bar Charts: Compare actual performance to target goals.
- Line Charts: Track progress over time.
- Gauge Charts: Visually represent progress towards a specific goal.
- Use Conditional Formatting:
- Highlight Key Metrics: Use conditional formatting to highlight cells that meet specific criteria, such as:
- Cells exceeding a certain threshold (e.g., 80% completion)
- Overdue cells
- Cells that are significantly below the target
- Create a Visual Indicator: Use color-coding to quickly identify the status of each KPI:
- Green: On track
- Yellow: At risk
- Red: Behind schedule
This provides a quick and effective way to monitor performance against goals. For a more detailed guide on creating powerful HR dashboards, check out how to boost HR decision-making with Excel dashboards.
4. Using Conditional Formatting for Easy Analysis: Spotting Trends and Outliers
Conditional formatting is a powerful tool that allows for the quick identification of high and low-performance levels. For example, you can use green formatting to highlight employees who exceed expectations and red formatting to flag underperformers, ensuring they receive immediate attention.
To apply conditional formatting:
- Navigate to the Home tab.
- Click on Conditional Formatting, and select New Rule.
- You can choose a specific format, such as bold font and green fill, to emphasize top performers.
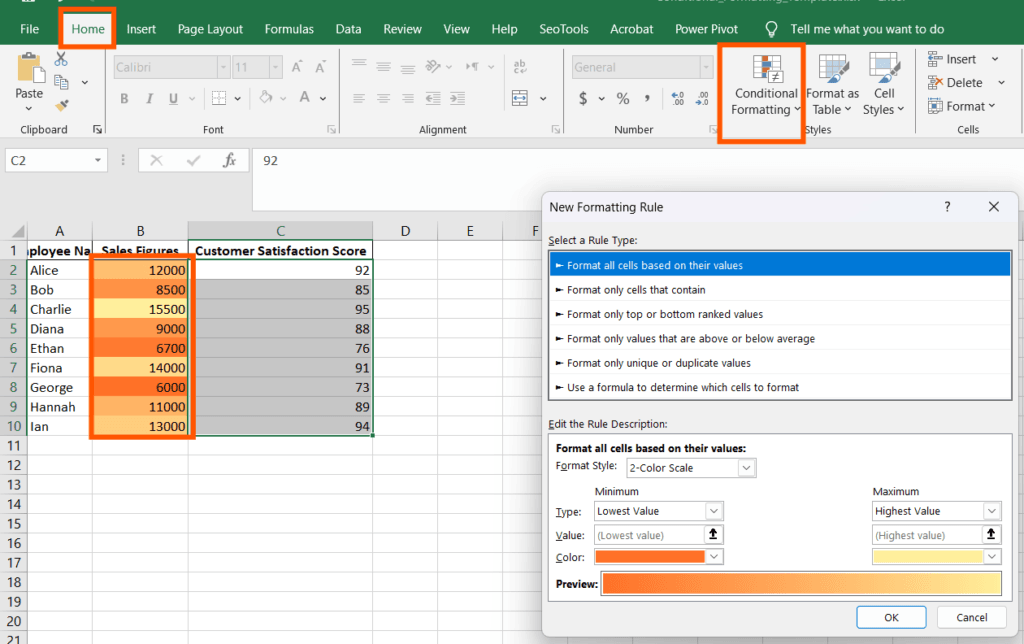
This visual approach makes it easier to recognize trends, such as departments that consistently excel or areas that require improvement. Additionally, it assists HR teams in taking timely actions to address any performance gaps.
Excel Tips for Improving Overall HR Efficiency
Excel offers a wide range of tools to make HR operations more efficient. From maintaining consistent data entry to automating tedious tasks, these features save time and ensure accuracy. Let’s explore how HR professionals can use Excel to optimize their workflows:
1. Data Validation for Consistent Data Entry
Consistency is essential when managing HR data. Errors in job titles, department names, or employee statuses can lead to confusion and complicate reporting.
Excel’s data validation feature helps ensure uniform entries by creating drop-down menus, which prevent manual typing mistakes and maintain clean, consistent datasets.
- Create Drop-Down Lists:
- Define a list of acceptable values for specific fields (e.g., job titles, departments, employment types).
- This prevents users from entering incorrect or inconsistent data.
- Set Data Ranges:
- Limit the range of acceptable values for numerical fields (e.g., salary, age).
- This prevents data entry errors and ensures data accuracy.
- Require Data Entry:
- Make specific cells required to be filled, preventing empty fields.
For example, for a job title field, you can create a drop-down list with the following options:
- Software Engineer
- Project Manager
- Data Analyst
- HR Specialist
Data validation in Excel allows you to ensure that only valid job titles are entered into the spreadsheet. This helps maintain data integrity and simplifies data analysis.
2. Using Macros to Automate Repetitive Tasks
HR teams often face repetitive tasks that can be time-consuming and error-prone. Excel macros provide a solution to automate these tasks and improve efficiency. Automate repetitive tasks like updating records, generating reports, or running payroll using macros.
How to Use Macros:
- Record a Macro: Record a sequence of actions, such as formatting cells, applying formulas, or copying and pasting data.
- Assign a Shortcut: Assign a keyboard shortcut to the macro for quick execution.
You can record actions and save them for future use to save time. By automating these repetitive tasks, HR teams can save time, reduce errors, and focus on more strategic activities.
3. Organizing Data with Power Query
Handling data from multiple sources—like recruitment platforms, attendance systems, or benefits providers—can be overwhelming. Power Query simplifies this by:
- Combining Data: Merge datasets from different files or sources into one unified spreadsheet.
- Cleaning Data: Remove duplicates, fix errors, and standardize formats.
- Transforming Data: Organize complex information into an analysis-ready structure.
For example, if recruitment data is scattered across job portals, Power Query can consolidate all this information into one structured table for easy reporting. This functionality simplifies analysis by providing a unified view of all relevant information.
4. Advanced Filtering for Quick Data Retrieval
Excel’s advanced filtering capabilities allow you to quickly extract specific data from large datasets. This is particularly useful for HR teams when dealing with employee records, performance data, or recruitment information.
By mastering advanced filtering techniques, HR teams can save time and effort when analyzing data, generating reports, and making informed decisions.
Excel Consultants for HR: Elevate Your HR Processes
Are you tired of manual, time-consuming HR tasks? Do you want to streamline your HR processes and gain valuable insights from your data? BSuite365 offers expert Excel consulting services to help you leverage the full potential of Excel for HR.
Our HR Excel Consulting Services Include:
- Data Management and Analysis:
- Organize and clean HR data.
- Create custom dashboards to visualize key metrics.
- Conduct in-depth data analysis to identify trends and patterns.
- Process Automation:
- Automate repetitive tasks like payroll calculations, report generation, and employee data updates.
- Develop custom macros and VBA scripts to streamline workflows.
- Performance Management:
- Design and implement performance management systems.
- Automate performance review processes and generate insightful reports.
- Recruitment and Onboarding:
- Create efficient recruitment trackers and applicant databases.
- Automate onboarding processes to streamline new hire onboarding.
- Payroll and Benefits:
- Optimize payroll calculations and deductions.
- Generate accurate and timely payroll reports.
- Manage benefits administration and enrollment.
Our experienced consultants have a deep understanding of HR processes and Excel’s capabilities. To learn more about how our Excel consultants can help your HR team, contact us today.
Conclusion on Excel Tips for HR
Excel is more than just a spreadsheet tool—it’s a game changer for HR professionals. By implementing these tips and tricks, HR teams can streamline recruitment, payroll, and performance tracking processes, saving time, reducing errors, and improving data-driven decision-making.
By using features like templates, dashboards, and automation, you can cut down on manual work and focus on strategic tasks. So, let’s unlock the full potential of Excel and make HR work smoother and more productive!
Our experts will be glad to help you, If this article didn’t answer your questions. ASK NOW
We believe this content can enhance our services. Yet, it’s awaiting comprehensive review. Your suggestions for improvement are invaluable. Kindly report any issue or suggestion using the “Report an issue” button below. We value your input.
About the Author: Fariba Me
document.getElementById(“review-notice”).remove();
document.getElementsByTagName(“hide-notice”)[0].parentNode.remove();
}


