What’s New in Microsoft Office Excel 2016?
Hi. As you probably know, the newest version of Microsoft Office, Microsoft Office 2016 was officially released a few days ago. Similar to the previous versions, this version includes many new features and enhancements. Excel, as a product of Office package, has always included a number of new capabilities and features in the latest version. We will get to know some of the most important new features of Excel 2016 in the following:
- New Charts
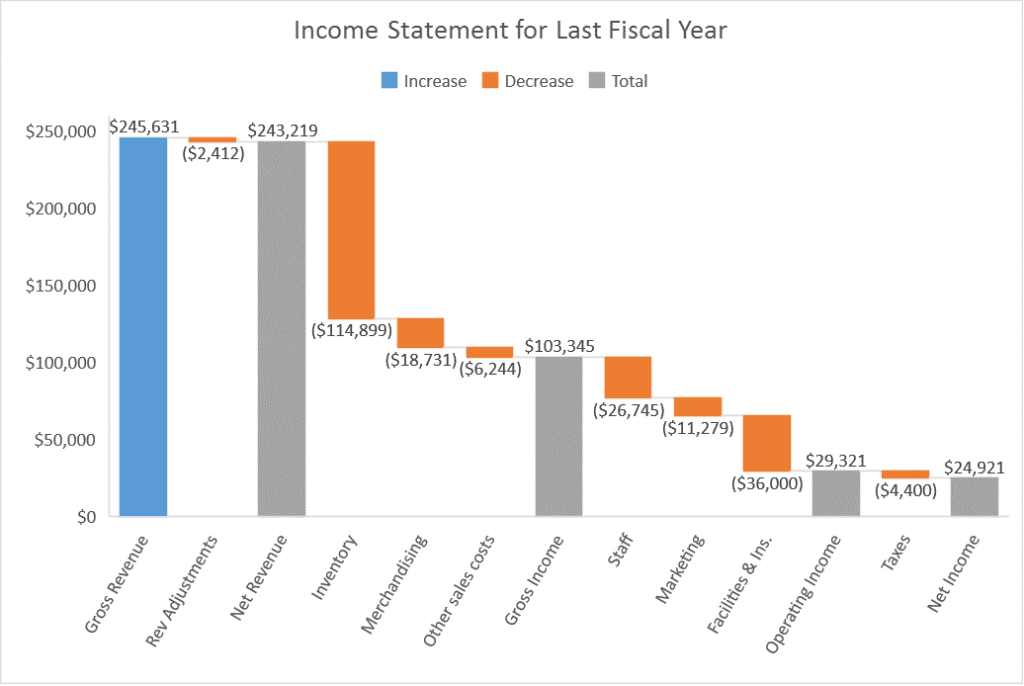
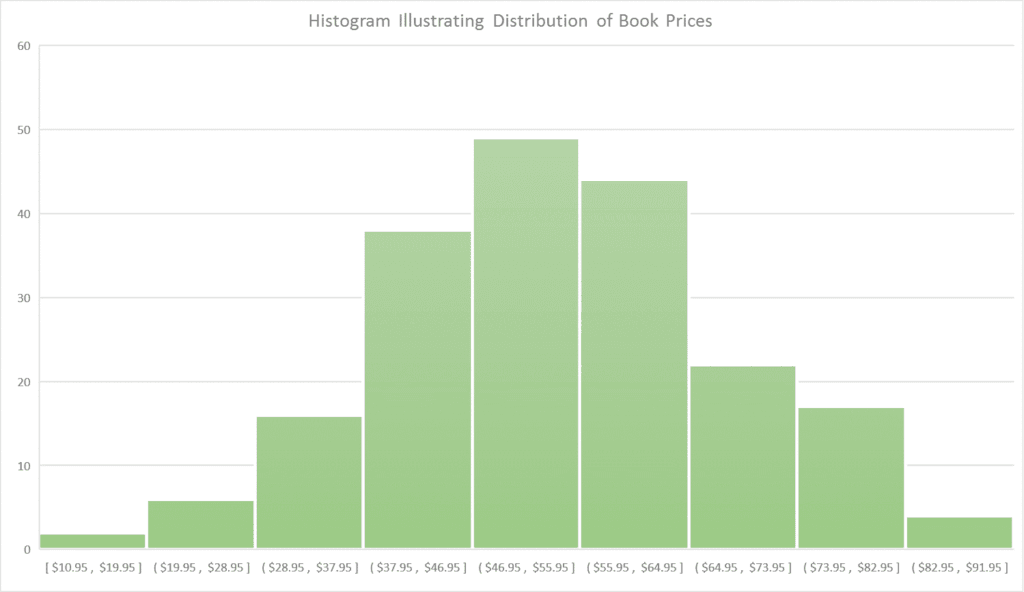
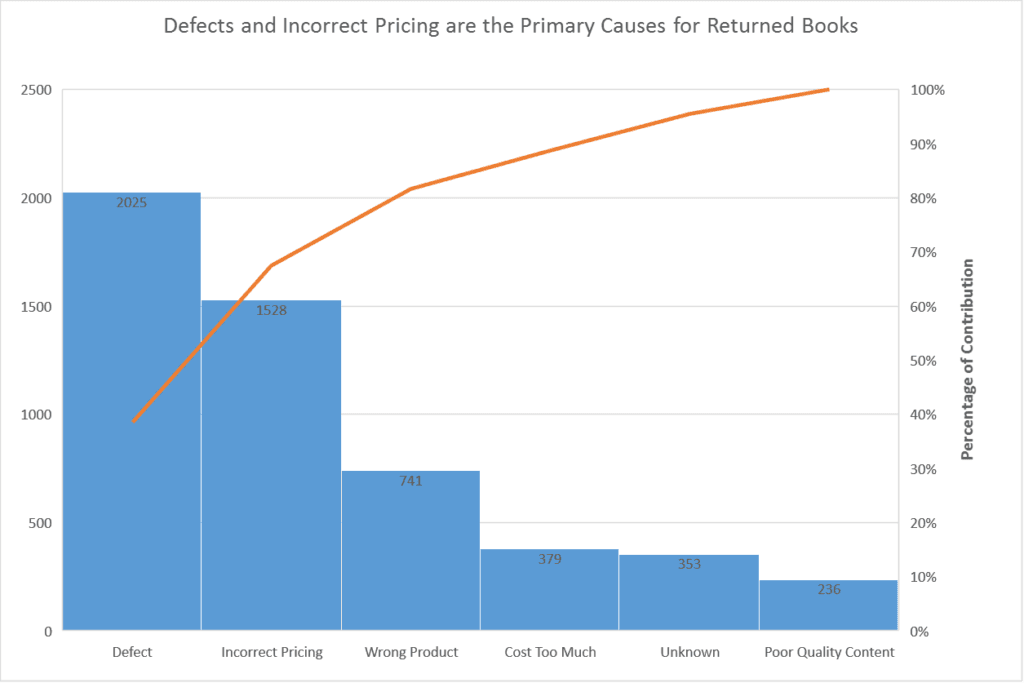
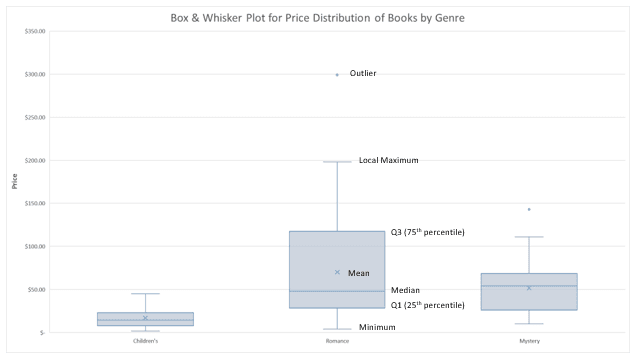
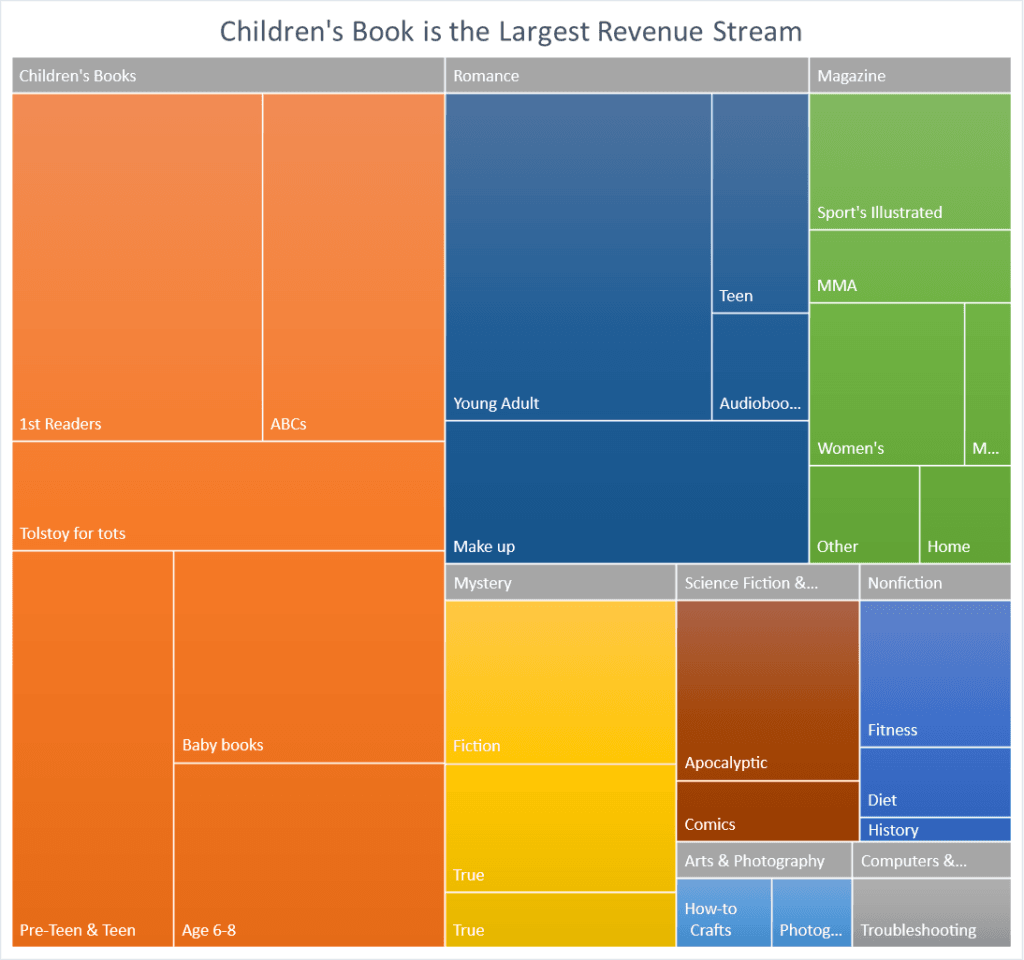
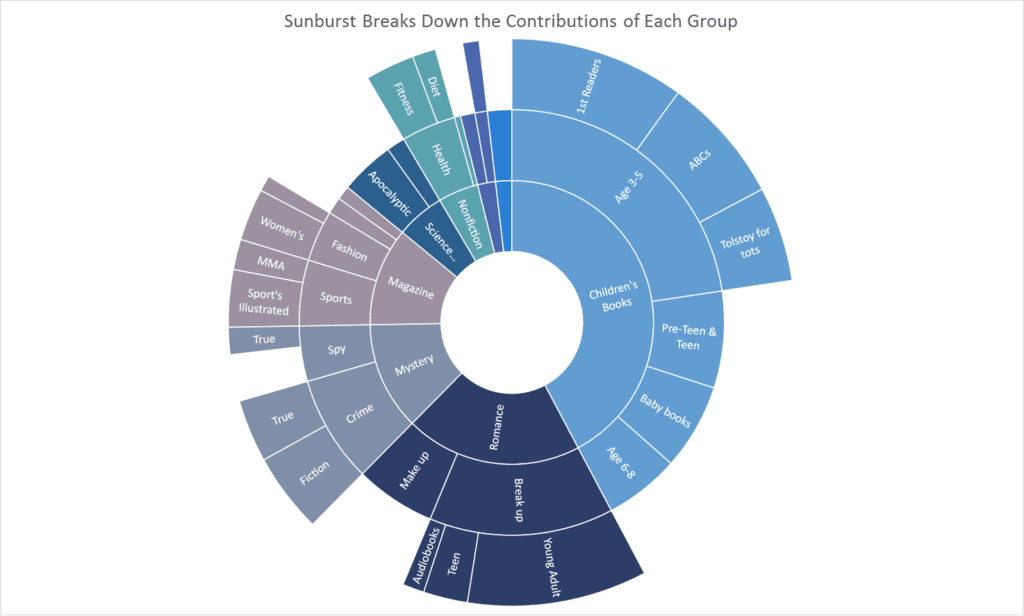
Six new charts have been added to Excel 2016. If you are struggling in making these charts, please contact our Excel data visualization experts.
Waterfall chart:
Histogram:
Pareto chart:
Box & Whisker plot:
Treemap chart:
Sunburst:
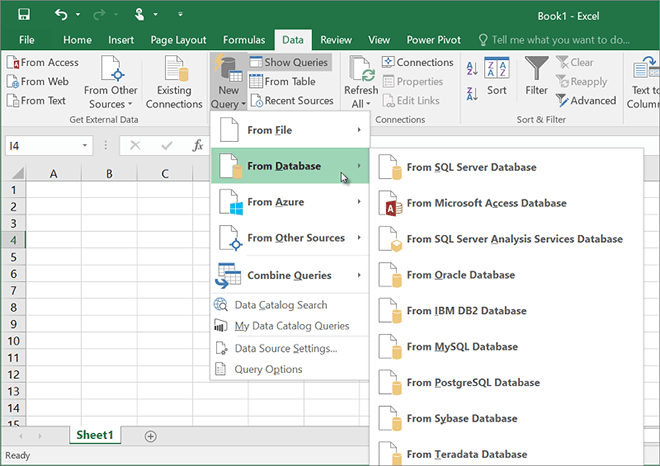
- Advanced functionality of Power Query
Power Query is one of the Excel add-ins which is provided as a built-in functionality in this version. Power Query allows the users to connect to and import data from different databases such as MySQL.
- Improvements in forecast functions
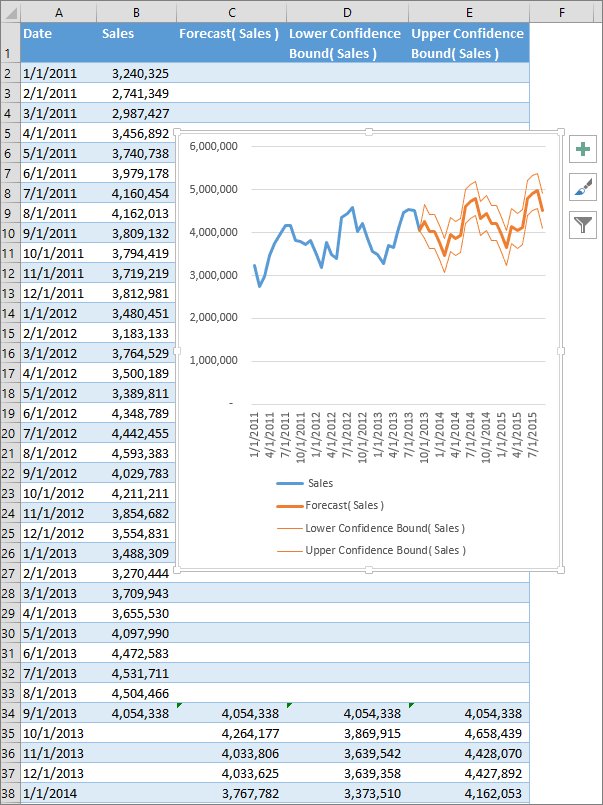
Unlike the previous versions of Excel which only included linear forecasting, Excel 2016 allows exponential forecasting, etc. and the corresponding functions have been added to the library of Excel. This feature is also available as One-click forecasting button to visualize forecasting of your data. In this tool you can also adjust forecast parameters such as seasonality, confidence interval, etc.
- 3D Map
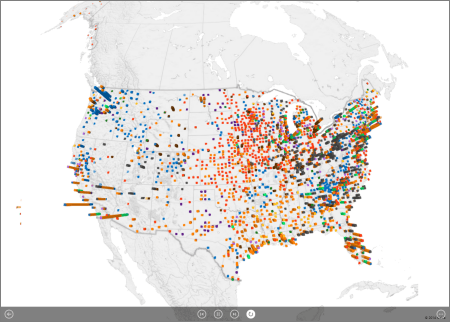
Previous versions of Excel included a powerful geospatial visualization add-in called PowerMap. This add-in has been renamed to 3D Map and is a built-in tool in Excel 2016 and is available to the users as default.
- Enhancements in Pivot Table
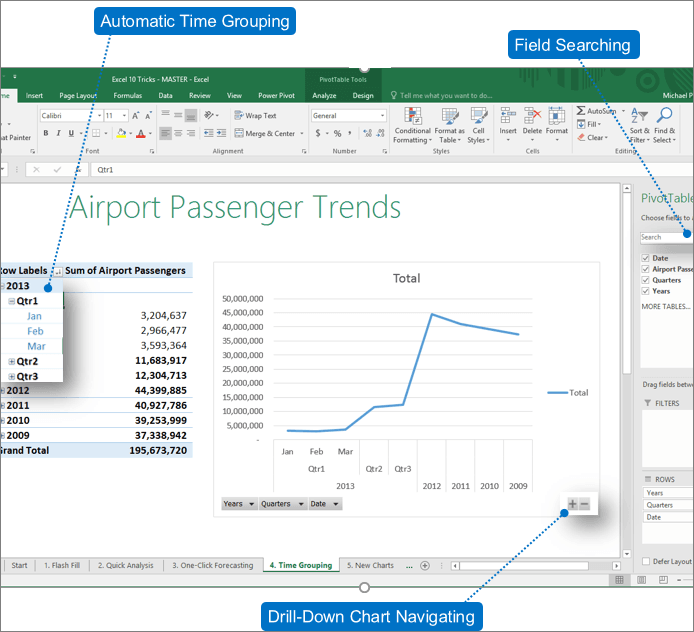
Pivot table is one of the most useful tools in Excel which has also been enhanced and updated in the new version. Here are some of the enhancements:
- Automatic detection and grouping of date fields
- Search in the fields
- Drill-down buttons to zoom in and out across the Pivot Chart
- Automatic detection of relationships between difference tables in the Pivot Table
- Multi-select slicer
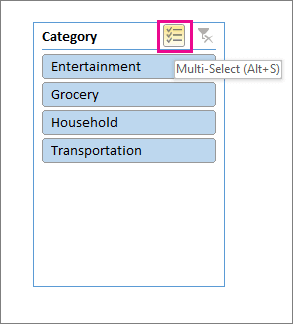
Slicer is a useful tool in Excel which allows users to quickly filter data. In the previous versions, only one item in Slicer could be filtered. In Excel 2016, you can use Multi-select button to select more than one item at once.
- Quickly search features with Tell me
In Excel 2016, there is a text box on the ribbon named as tell me what you want to do. You can type words and phrases related to what you want to do and quickly find the features you want to use without the need to open different menus.
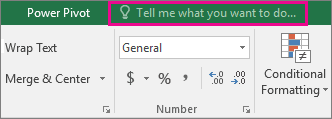
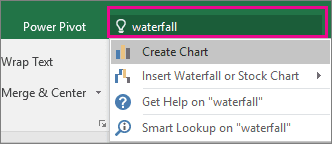
For example, by typing the word waterfall all the features related to creating a waterfall chart will be shown.
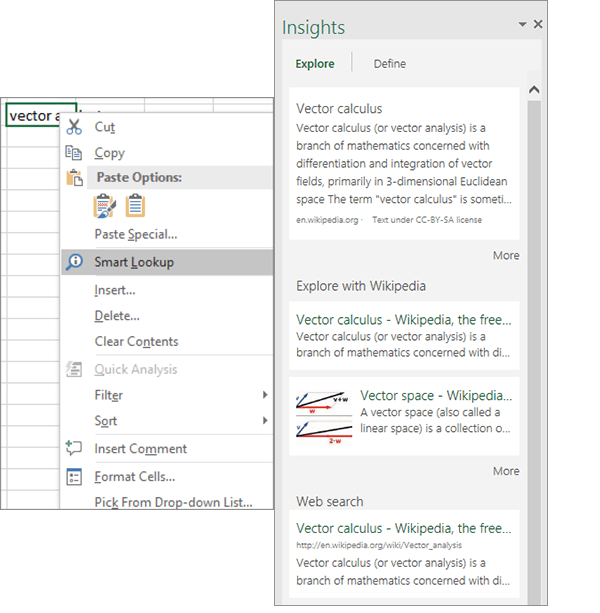
Smart Lookup
In Excel 2016, you can select a word or phrase, right-click it and choose Smart lookup to get different information from the internet.
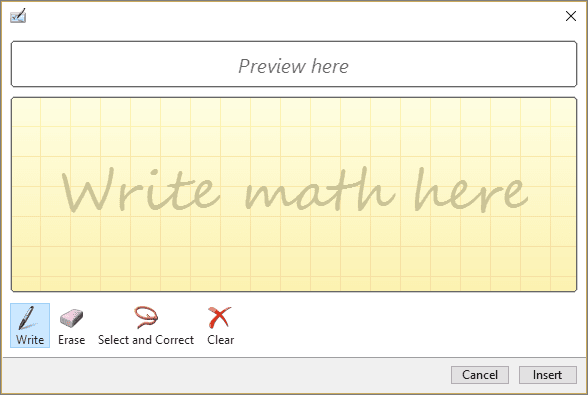
- Build your own math equations using Ink Equation
You can use touch stylus or mouse to write your own equations by hand and Excel will convert it to text.
- Enhancements in file sharing
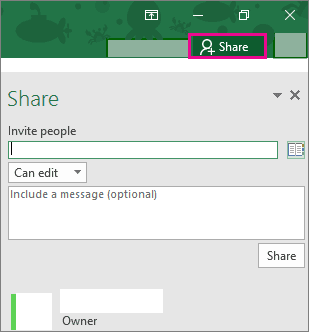
As you see in the figure below, there is a button on top right that makes it easy to share your information with others.
- Version History
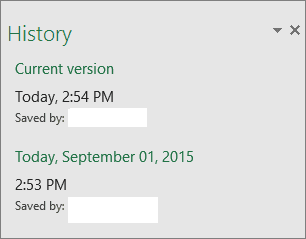
If you store the files on OneDrive for business or Sharepoint, you can see the changes made to your files and open the earlier versions using History in Excel 2016.
- New Themes
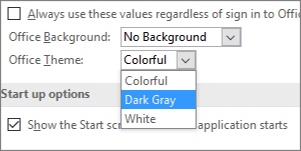
In Excel 2016, there are three new themes that you can apply: White, colorful, Dark gray
- Publish data with Power BI
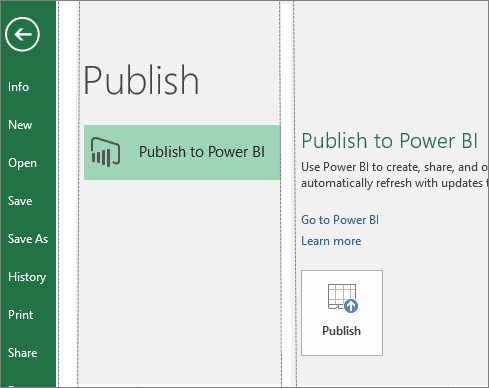
If you are currently using Power Bi, you can easily share your files in Power Bi by using the newly added option in Excel Backstage.
Looking for Excel Business solutions? please contact us through the Microsoft Excel solutions page. Or if you’re in Vancouver, please visit our Excel consulting Vancouver page.
Our experts will be glad to help you, If this article didn’t answer your questions. ASK NOW
We believe this content can enhance our services. Yet, it’s awaiting comprehensive review. Your suggestions for improvement are invaluable. Kindly report any issue or suggestion using the “Report an issue” button below. We value your input.


