How to Calculate the Area Under a Curve in Excel
Understanding how to calculate the area under a curve in Excel is a valuable skill that can provide insights into trends, patterns, and overall performance across various fields. This is the total area covered between the curve and x-axis within a range of x-values, widely used in data science and relevant contexts. Excel offers multiple methods to perform this task efficiently, and we will explore two of them in this blog post. These methods will enable you to derive meaningful conclusions from your datasets, so let’s see how to find the area under a curve in Excel.
If you’re interested in a more advanced approach, check out our guide on how to calculate integrals in Excel, which explores additional techniques for solving complex mathematical problems.
Calculating the Area Under a Curve with Trapezoidal Rule
Trapezoidal Rule, a numerical method, allows for an accurate approximation of this area by segmenting the curve into trapezoids, thereby simplifying complex curves into manageable calculations. Let’s see how to calculate the area under a curve in Excel, using this method:
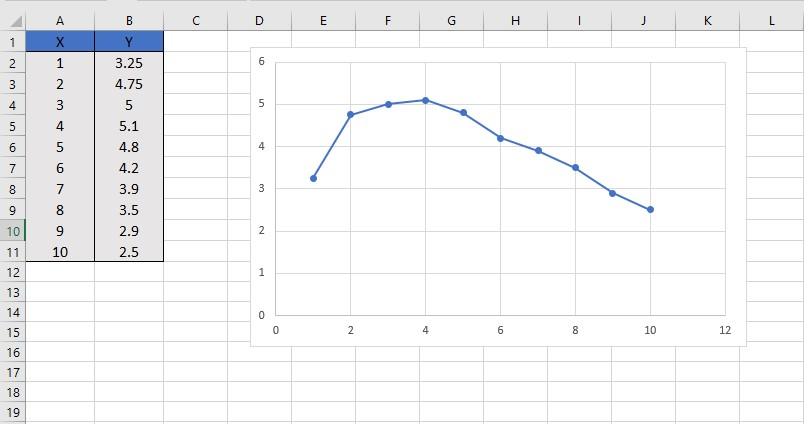
Suppose you have this data table with its relevant curve.
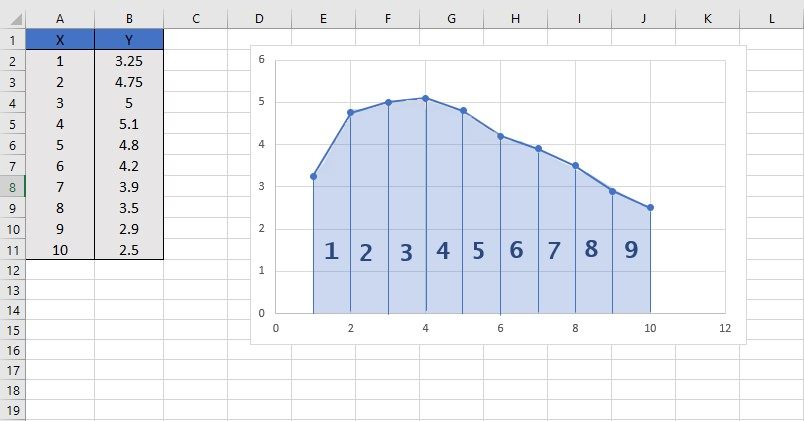
You can divide the total area into multiple trapezoid areas like this:
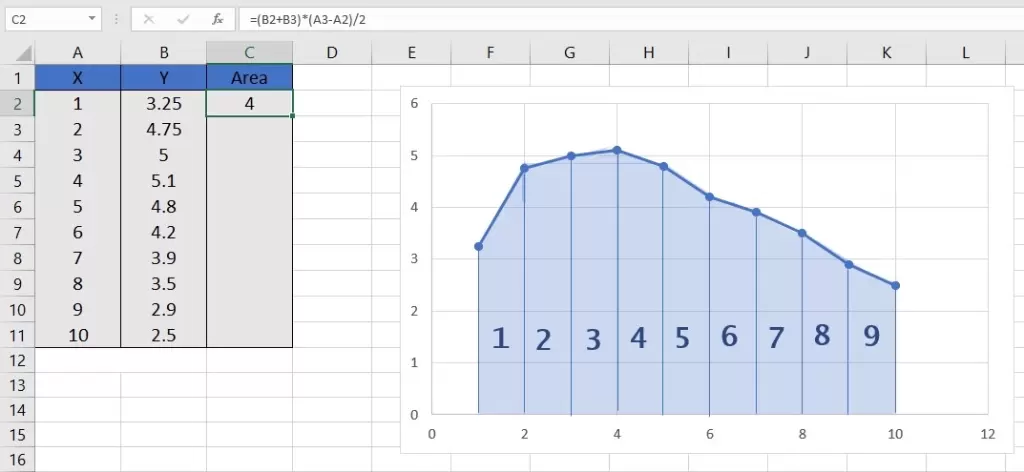
Then add another column (Area) to calculate the area of each trapezoid between data points.
Now you only need to apply the mathematical formula used for calculating the area of the trapezoid:
When applied to the aforementioned data table, the formula is adapted as follows:
Drag the fill handle through the rows except for the last one to calculate the area of all trapezoids.
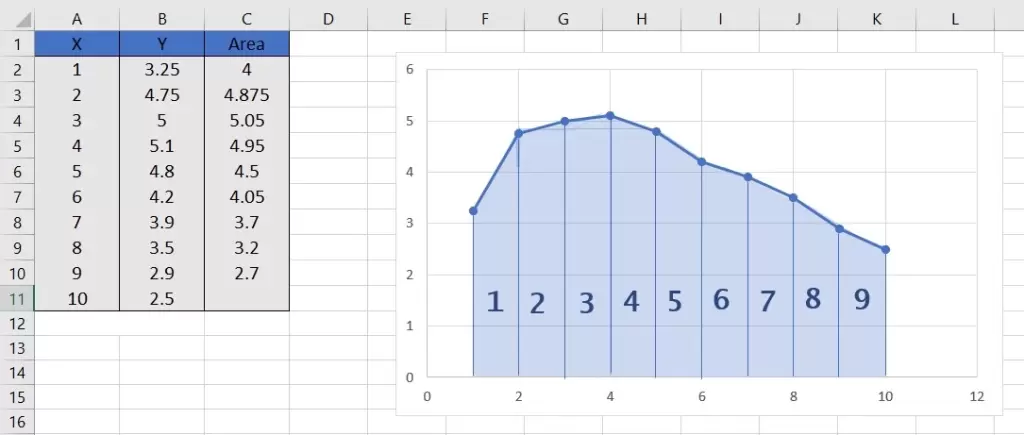
Now you can sum up the values and calculate the total area under the curve using the SUM function:

Unlock valuable insights with our Data Visualization and Data Analytics Services, transforming complex data into clear, actionable strategies for informed decision-making.
Calculating the Area Under a Curve with Excel Chart Trendline
Another way of calculating the area under a curve is through the use of its equation. You can use the chart trendline in Excel and access the curve’s equation. Let’s delve deeper into how to calculate area under a curve in Excel, using the trendline.
You only need to follow these steps for this purpose:
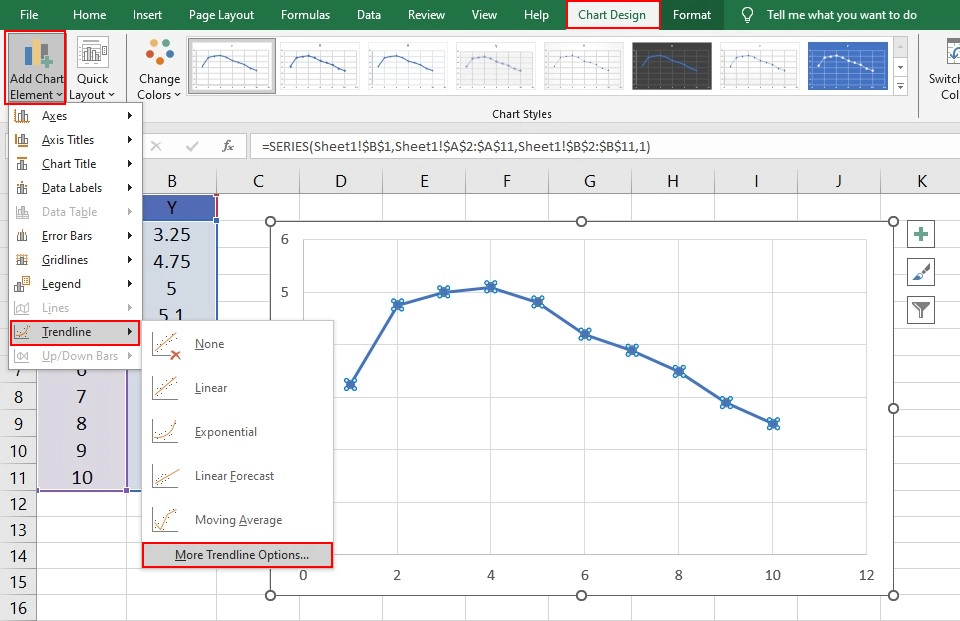
First, select the chart, go to the “Chart Design” tab > “Chart Layouts” and click on the “Add Chart Element” dropdown list.
Select “Trendline” and then “More Trendline Options”.
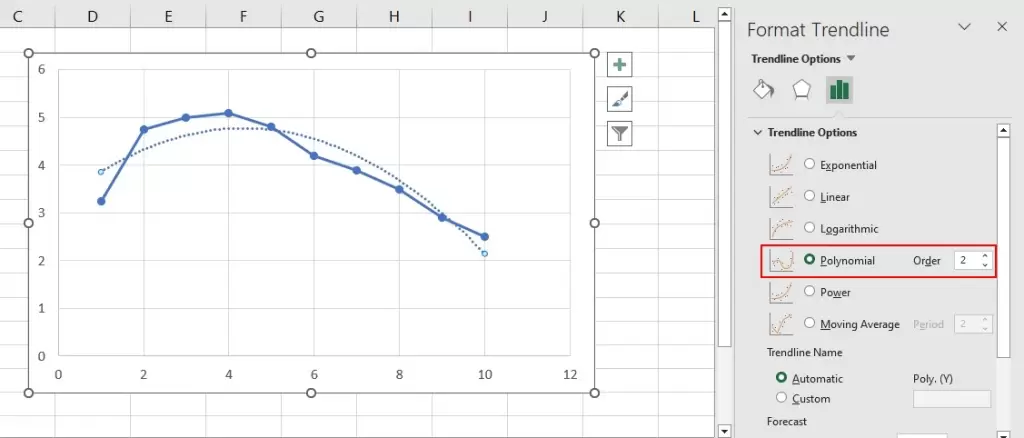
The “Format Trendline” pane will pop up.
In the “Trendline Options” section, select “Polynomial”.
Then check “Display Equation on Chart”.
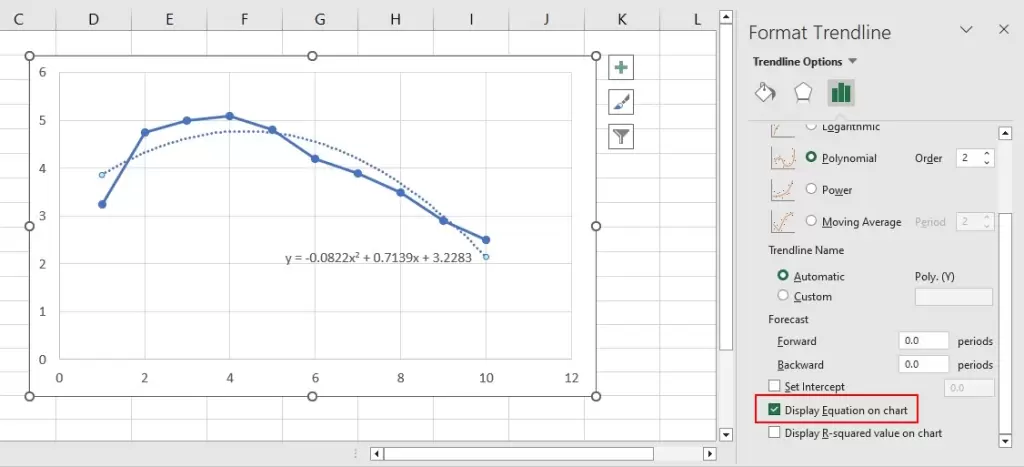
Now you can see the related equation on the chart.
In this step, you need to get the definite integral of the equation. You can do it by yourself or use a graphing calculator to compute it online quickly and visualize the function as well.
In our example, the integral would be:
F(x) = -0.0274 x ^ 3 + 0.35695 x ^ 2 + 3.2283 x + C
You should calculate the function value for two points, x=1 and x=10. (These are the beginning and the end of the curve.)
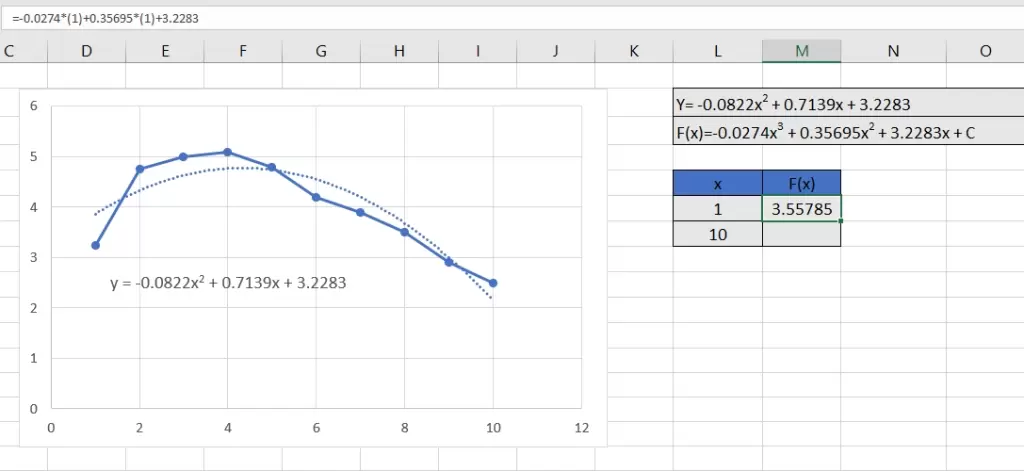
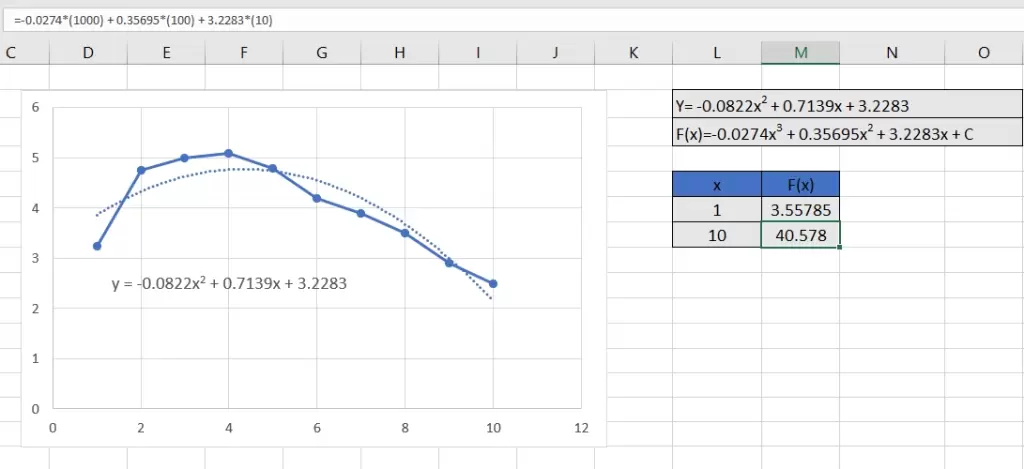
To find the area under the curve, calculate the difference between two values:
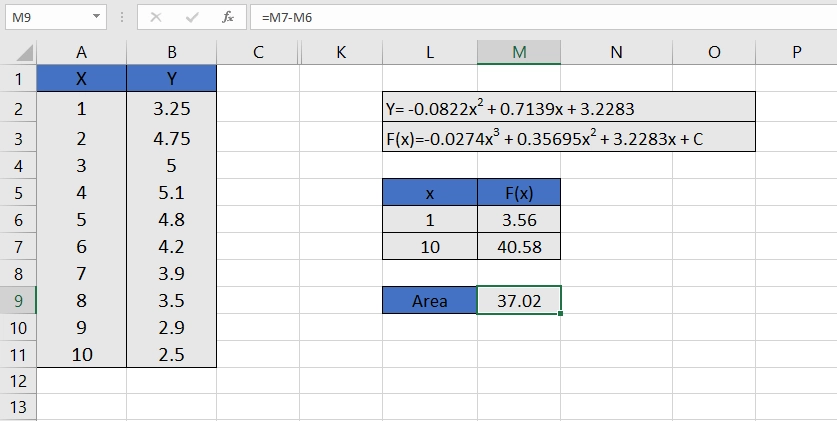
This is the final value as the area under the curve.
Boost your productivity by getting a free consultation from Excel experts, and discover tailored solutions to optimize your data management and analysis.
Conclusion
In this blog post, we explained how to calculate area under a curve in Excel, using two straightforward methods. By understanding and applying these techniques, you can unlock deeper analytical capabilities within Excel, making it an even more powerful tool in your data analysis processes. Remember, the choice of method depends on your specific dataset and analytical needs, but either approach will equip you with the means to extract meaningful information from your data.
To enhance your data analysis capabilities, consider leveraging Professional Excel Consulting Services to streamline complex calculations and optimize data-driven decision-making.
FAQs
Yes, Excel can approximate the area under a curve using numerical methods like the Trapezoidal Rule or by integrating a trendline equation derived from data points.
Yes, you can calculate the area for any type of data as long as you can plot it on a graph or apply a suitable numerical method to approximate the area.
You can find the equation of a curve by adding a trendline to your chart in Excel and then displaying the equation on the chart.
For irregular curves, you can use numerical approximation methods like the Trapezoidal Rule to estimate the area under the curve directly from plotted data points.
Yes, there are Excel add-ins and third-party tools designed for advanced data analysis that can simplify these calculations, but the built-in features of Excel are often sufficient for basic to moderately complex tasks.
You can analyze multiple curves or datasets in a single Excel file by plotting them on separate charts or using separate calculations for each dataset. It’s essential to organize your data well to avoid confusion.
Yes, you can calculate the area between two curves by finding the area under each curve separately and then subtracting one from the other, assuming you have the equations or numerical methods to approximate the area for both curves.
Our experts will be glad to help you, If this article didn’t answer your questions. ASK NOW
We believe this content can enhance our services. Yet, it’s awaiting comprehensive review. Your suggestions for improvement are invaluable. Kindly report any issue or suggestion using the “Report an issue” button below. We value your input.


