How To Calculate Correlation Coefficient In Excel
In experiments, the next step after gain variables is finding relevance intensity among them. Excel makes the calculations easy by using the functions or data analysis tools In this tutorial, We’ll know what the correlation coefficient is and how it works and then clarify the calculation process in Excel.
What Is the Correlation Coefficient?
The correlation coefficient (a value between -1 and 1) tells you about the relationship between the two variables.
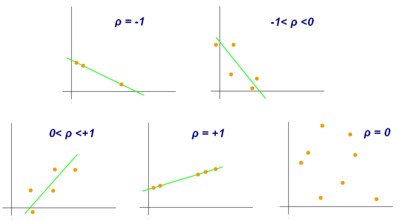
According to the picture ()
- -1≤ρ<0: means the negative linear correlation (a negative direction relevance between variables)
- 0<ρ≤1: means the positive linear correlation (a positive direction relevance between variables)
- ρ=0: means no linear correlation (no relevance between variables)
Another way to figure the relationship between two variables is Covariance. But the amount of Covariance is affected by the units of variables measurement, making it challenging to compare large numbers. To standardize the amount of dependence between two variables, we use the correlation coefficient.
The Correlation Coefficient Formulas
We have two formulas for calculating the correlation coefficient in Excel.
- CORREL
- PEARSON
The CORREL formula is more accurate than the PEARSON function and is especially suitable for huge numbers.
Calculate the Correlation Coefficient by the CORREL Function
Method one:
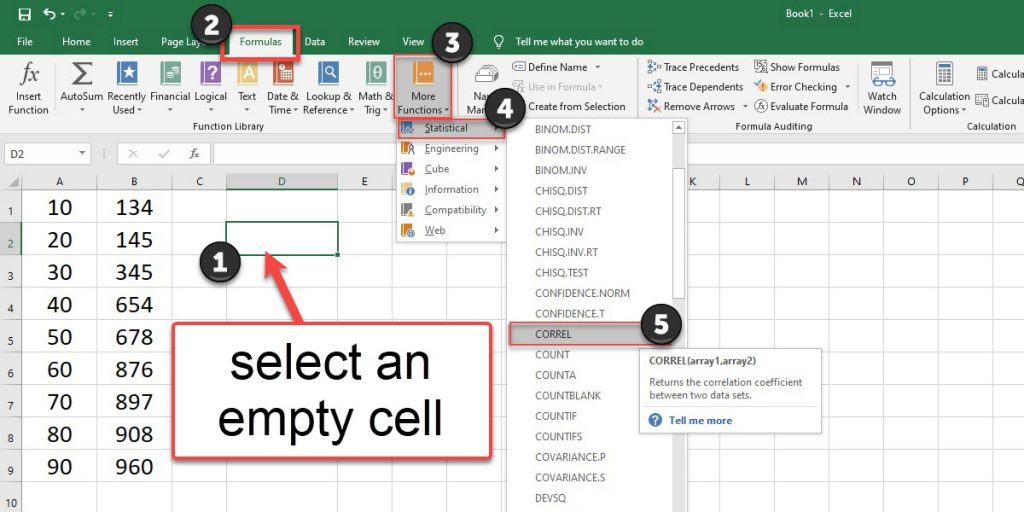
Here we have two sets of data. So, to calculate the correlation coefficient, follow these steps:
- Select the cell that you want to put the result.
- Go to the Formulas tab.
- Select the More Function button.
- From the Statistical menu, pick the CORREL function.
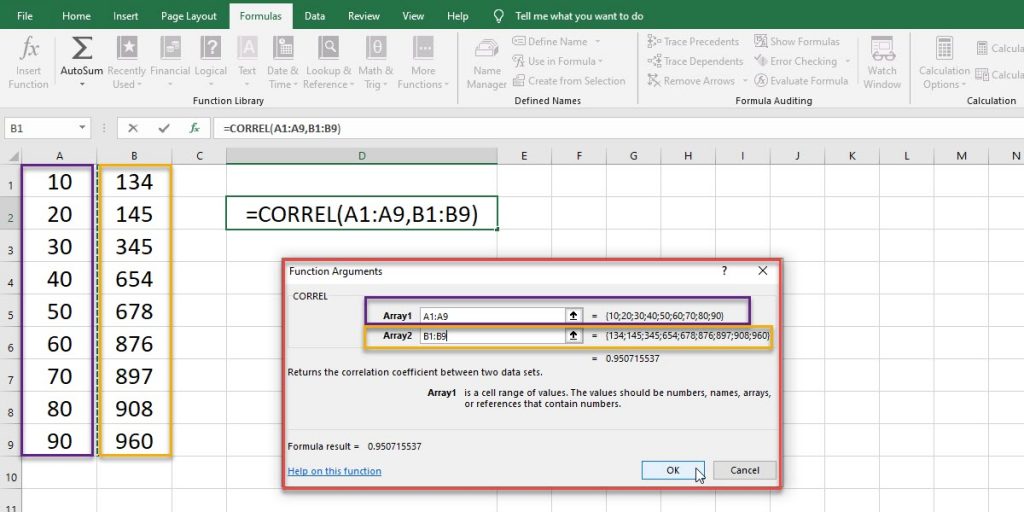
- Now, select the Array1 (first set of data) and Array2 (second set of data).
- Press OK.
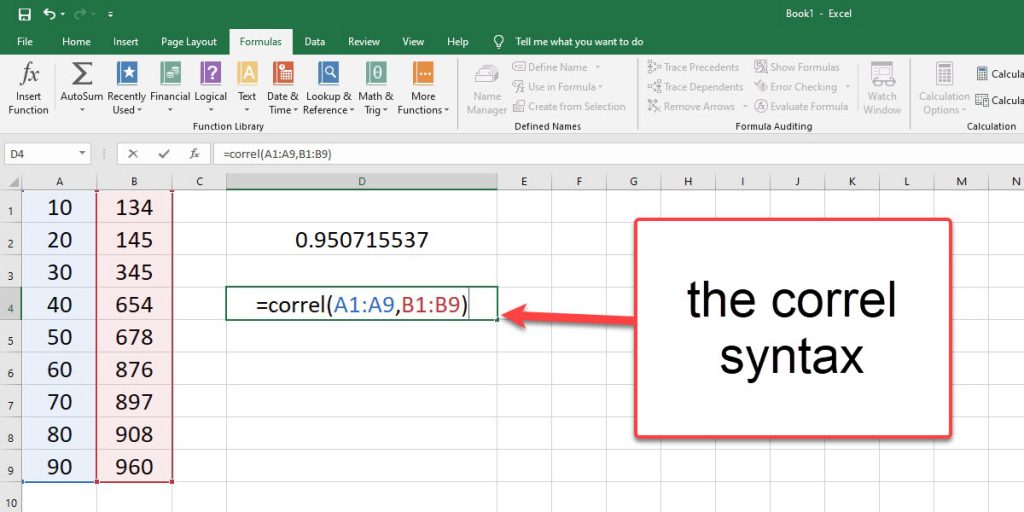
Method two:
- Select an empty cell.
- Enter = to write the CORREL syntax.
- Select the Array1 (first set of data) and Array2 (second set of data).
- Press Enter.
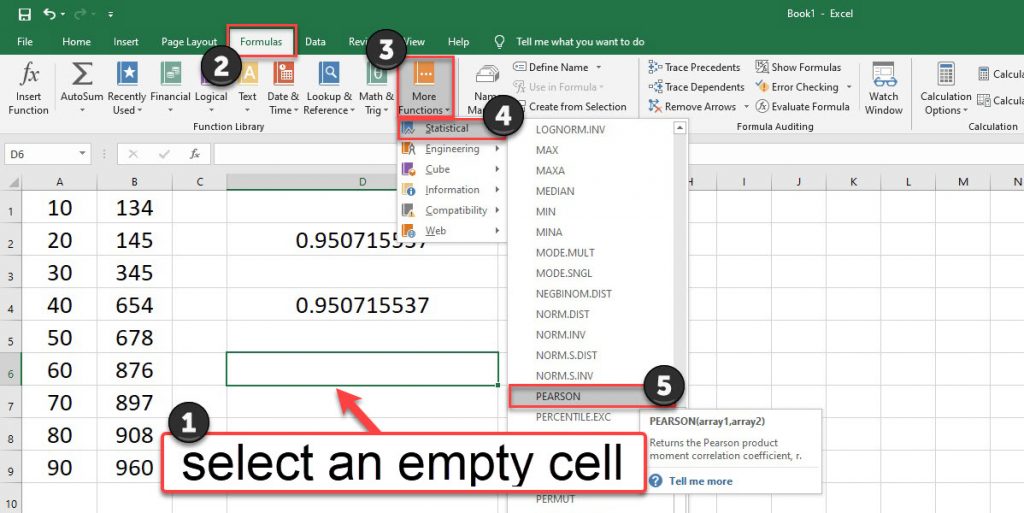
Calculate the Correlation Coefficient by the PEARSON Function
Calculating the correlation coefficient by the PEARSON function is exactly like the way you use the CORREL function. Here, we have two sets of data, and we have two ways to enter the PEARSON function.
Method one:
- Select the cell that you want to put the result.
- Go to the Formulas tab.
- Select the More Function button.
- From the Statistical menu, pick the PEARSON function.
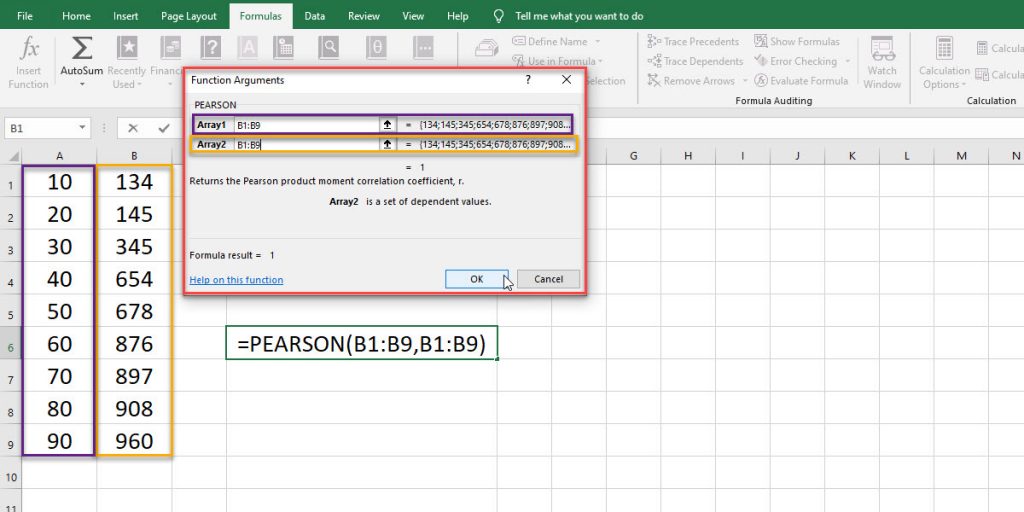
- Now, select the Array1 (first set of data) and Array2 (second set of data).
- Press OK.
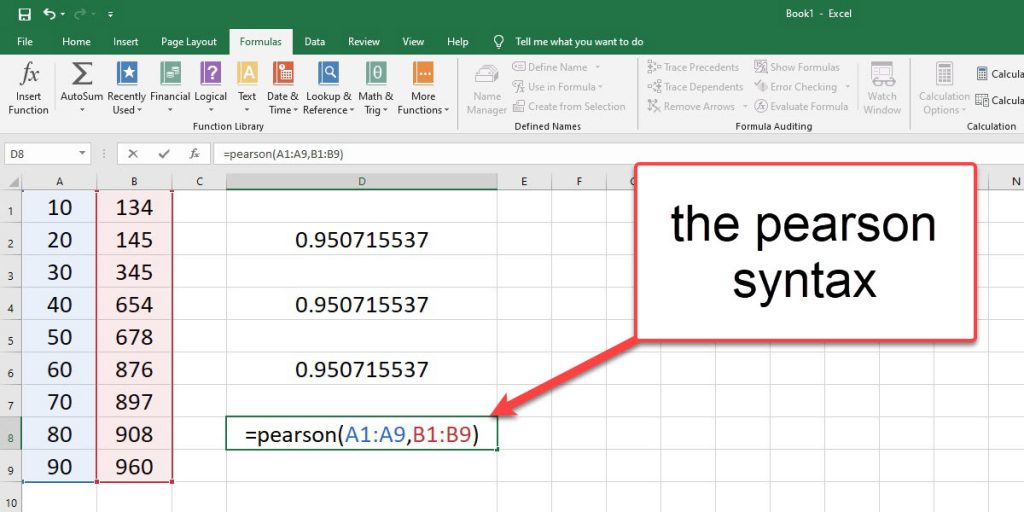
Method two:
- Select an empty cell.
- Enter = to write the PEARSON formula.
- Select the Array1 (first set of data) and Array2 (second set of data).
- Press Enter.
Calculate the Correlation Coefficient by the Data Analysis
First, to enable the Data Analysis to follow these steps:
- Go to the File tab from the ribbon.
- Click on the Option.
- Click on the Add-ins.
- From the Manage menu bar, select Excel Add-ins, and press Go.
- Check the Analysis ToolPak checkbox and press OK.
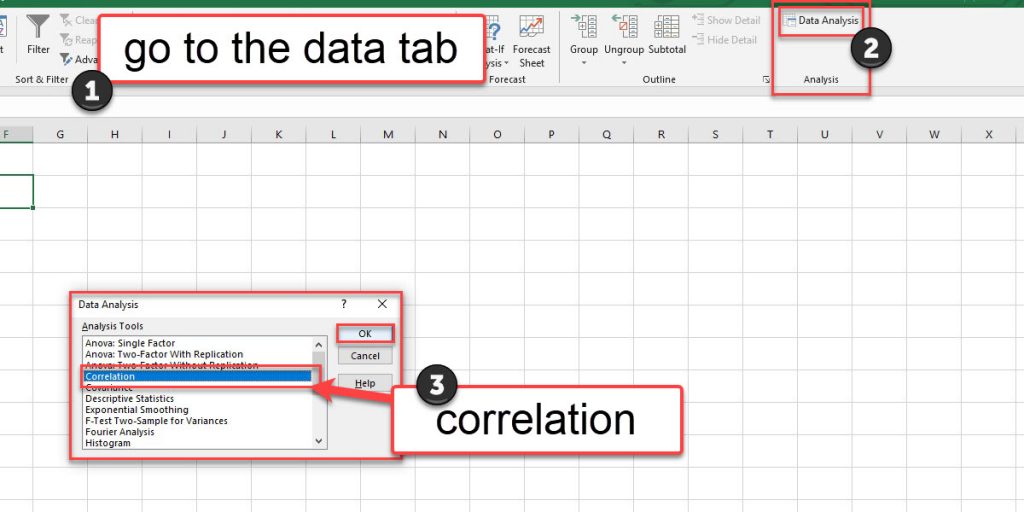
Now you can find the Data Analysis option on the Data tab from the ribbon. So, Calculate the Correlation Coefficient:
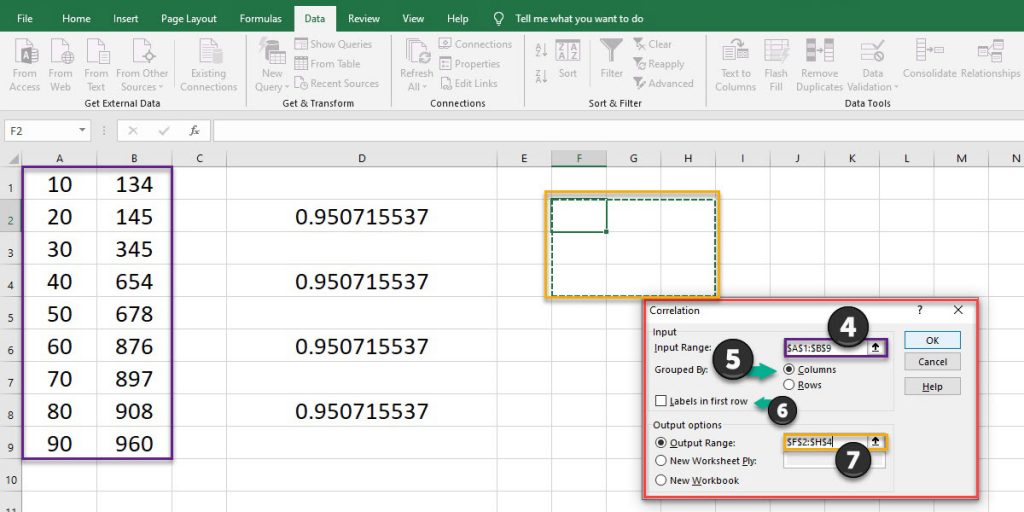
- Go to the Data tab.
- From the Analysis group, select the Data Analysis.
- From the Data Analysis dialogue box, pick the Correlation, and press OK.
- In the Correlation dialogue box, select the data range as the input range.
- Check the columns or rows checkbox according to your data.
- If your data sets have labels, check the Labels in first row checkbox.
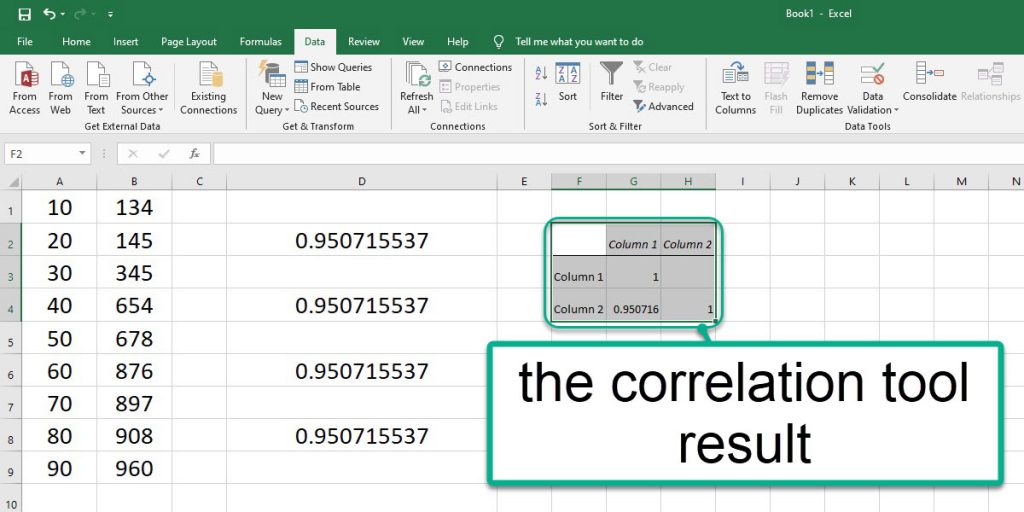
- Select an empty range to enter the Output range to see the result and press OK.
You can connect with us and ask our experts for your inquiries and get more Excel Support Services.
Reduce costs, accelerate tasks, and improve quality with Excel Automation Services.
Our experts will be glad to help you, If this article didn’t answer your questions. ASK NOW
We believe this content can enhance our services. Yet, it’s awaiting comprehensive review. Your suggestions for improvement are invaluable. Kindly report any issue or suggestion using the “Report an issue” button below. We value your input.


