How To Make A Histogram In Excel – 2 methods
A Histogram Chart is a precise plot to indicate the frequency dispensation of numerical data. Karl Pearson presented a histogram for use in Statistical Analysis.
Learn more about the concept of histogram in Wikipedia.
Excel Histogram Bin Range
Disarticulating the data into intervals (which is called BINs), and the number of incidences (which is called frequency), creates a histogram. Bins are generally determined as successive, and they must be adjoining too. Meanwhile, they’re defined as the non-overlapping distance of the variables.
The data must be measured on an extendable criterion, for example, volume, time, temperature, etc.
Histogram demonstrates the optical deputation of data dispensation, to figure out the usage of a histogram, we’ll bring up a plain example.
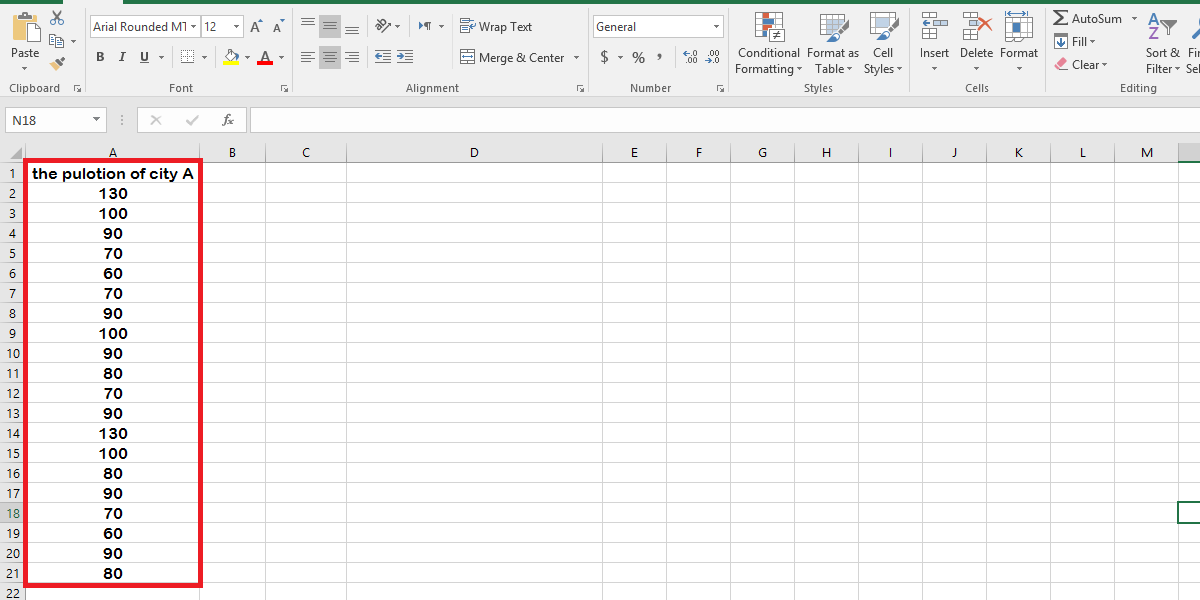
Assume some information is collected about the air pollution level in City A for 20 days.
The difference between a histogram chart and a bar chart is, a histogram relates only one variable, but a bar chart is pertinent to two. So there is no gap in the data in a histogram chart. Also, histogram charts are based on area.
The Main Prerequisite (For Excel 2007, 2010 & 2013)
For statistical applications, Excel has an add-in program that provides data analysis tools, which is called ANALYSIS TOOLPACK. To run this data analysis tool, follow these steps, please (because it’s disabled in default setting):
1. Click on the File Tab.
2. Select Options.
3. Click on the Add-Ins menu from the sidebar.
4. Select “Excel Add-ins” and then click “Go” from the Manage dropdown menu.
5. Check the “Analysis ToolPak” box and then click “OK.”
video 1- how to enable Analysis ToolPak
How to Do a Histogram in Excel
There are 2 common methods to make a histogram plot.
Method 1- built-in Histogram Chart (Excel 2016)
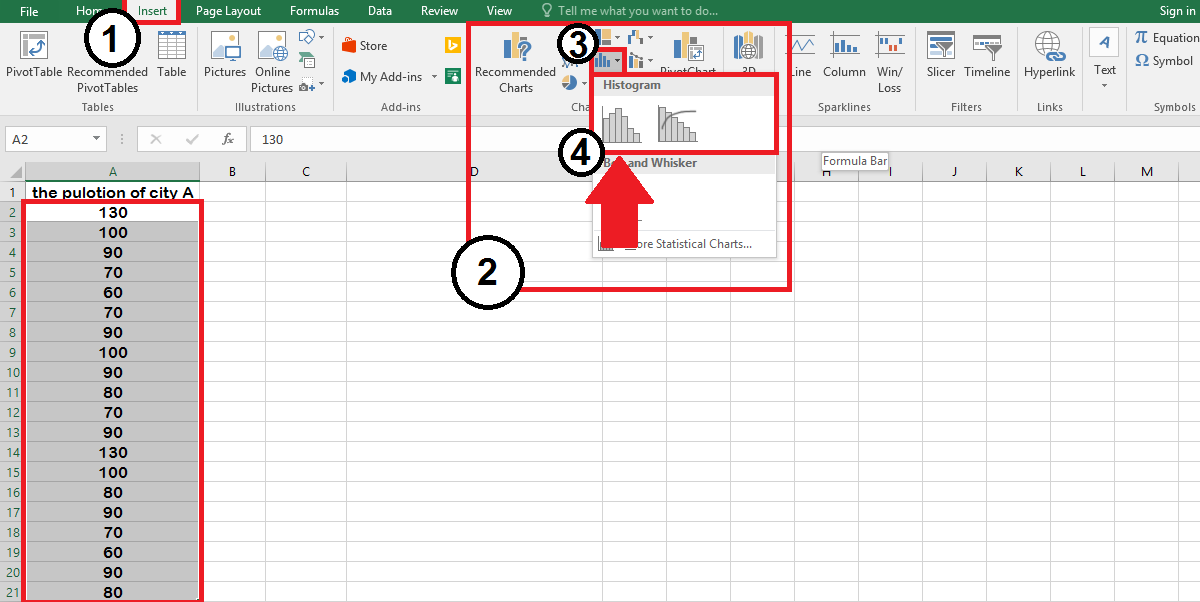
After highlighting your data, follow these steps:
1. Click on the Insert tab.
2. Click on “Insert Statistical Charts” from the Charts section.
3. Select the Histogram chart.
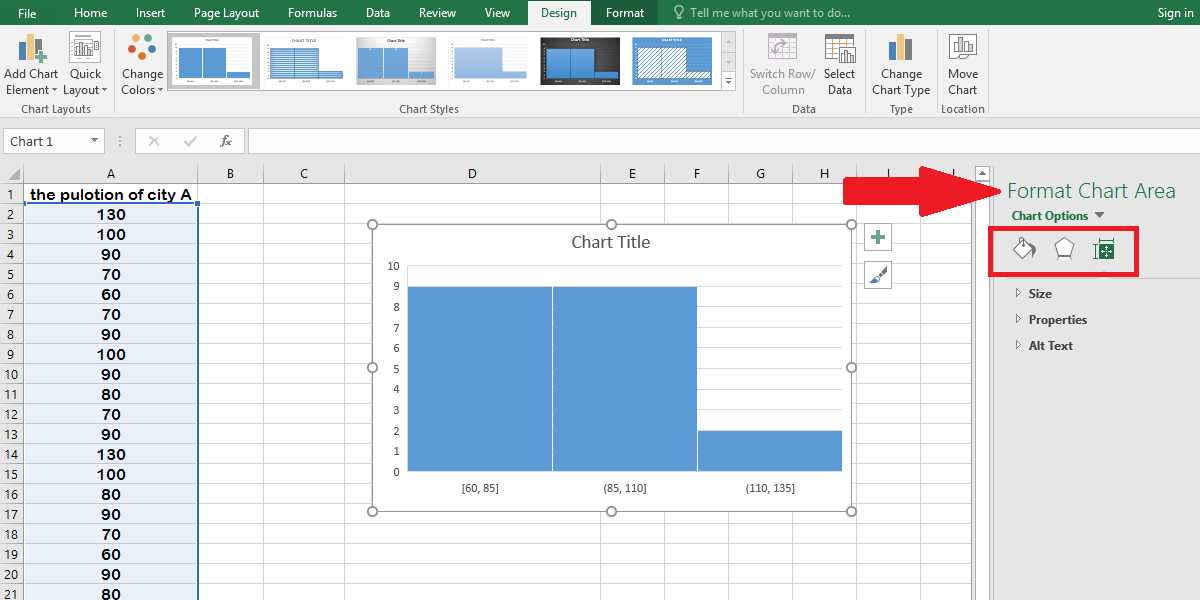
Now, Excel will plot a histogram based on your highlighted data. You can also adjust this chart; by double-clicking on the chart area, a pane (FORMAT CHART AREA) opens on the right side.
Enhance your software capabilities with our customizable Add-In Solutions, seamlessly integrating new features to meet your business needs.
You can change the appearance of your chart by these options:
1. Double click on the Chart
2. Click on the Design tab.
3. Select the Change Colors
4. In this section, you can change the color range of the chart.
5. From the Format Chart Area, you also have other options such as fill & Line, Effects, and Size.
Or use the options on the Design tab.
Video 2- change the appearance of the chart
By the way, you can customize the bins. Bin width is selected automatically by default, and to edit it follow this path:
1- Double click on the chart area to open Format chart Area pane.
2- Click on the Chart options.
3- Select the Horizontal category axis.
4- Click on the Axis options.
5- The Bin options are:
– By category: to count and calculate the sum of data (when we have category’s name)
– Automatic
– Bin width
– Number of bins
Video 3- customize the bin of histogram chart
Empower your business with our Excel Programming and VBA Macro Development Services, tailored to automate tasks and unlock the full potential of your data management capabilities.
Method 2- Analysis ToolPak (Excel 2007, 2010 & 2013)
After enabling the Analysis ToolPak (as a histogram graph maker), follow the path below:
1- Go to the Data tab from the menu bar.
2- Analysis section.
3- Click on the Data Analysis button.
4- Select the Histogram tool.
5- Press OK
6- Input your range.
7- Input the Bin range.
8- Enter the Output options (optional.)
9- Press OK.
Video 4- how to create histogram chart in Excel 2007, 2010 & 2013
You can connect with us and ask our experts about your questions and get support.
Reduce costs, accelerate tasks, and improve quality with Excel automation.
Our experts will be glad to help you, If this article didn’t answer your questions. ASK NOW
We believe this content can enhance our services. Yet, it’s awaiting comprehensive review. Your suggestions for improvement are invaluable. Kindly report any issue or suggestion using the “Report an issue” button below. We value your input.


