How To Calculate P-value In Excel?
P-value, which is short for “probability value,” indicates the probability of error in accepting the observed result’s validity. It is used in hypothesis testing in statistical calculations. In this blog, we are going to discuss what p-value is and how to calculate it.
The Concept of P-value
To understand what p-value is, we should first know what the hypothesis test is. In simple words, a hypothesis test is a statistical test used to determine if an assumption is true or not for a population. It is a way to test the results of a survey or experiment to see if the results are meaningful. A Hypothesis test includes two hypotheses:
Null hypothesis (H0): It is usually the hypothesis that the event will not occur or the results are by chance.
Alternative hypothesis (Ha): It is a hypothesis that the event will occur, or the results are not by chance.
Alpha: It is the threshold value in the hypothesis test by which the null hypothesis can be rejected or accepted. A common value for Alpha is 0.05.
We calculate a parameter called “p-value” that states the results are valid during a hypothesis test, or they have happened by chance: the smaller p-value, the stronger evidence in favor of the alternative hypothesis.
A low p-value indicates that the observed data is unlikely under the null hypothesis, leading to its rejection in favor of the alternative. For example, when comparing variances between two groups, you might use an F-Test in Excel, which also relies on the interpretation of the p-value.
In Excel, we can calculate the p-value using two main methods: t-test and z-test.
Boost your productivity by getting a free consultation from Excel experts, and discover tailored solutions to optimize your data management and analysis.
T-Test or Z-Test?
we should check the sample size: for the small samples, a t-test will give a better result. If the sample size is 30 or more, we must choose the z-test. If the variance of the population is known, the z-test will be a better choice.
T-test
There are two ways to perform a t-test in Excel:
1. T-Test Tool From Data Analysis ToolPak
The first thing we should do is to add the analysis ToolPak to Excel. To do so, click on files > options; In the window that opens, click on Add-ins. Check if the “Excel Add-ins” option is selected in the manage box, then click on “go.” In the next window, check the Analysis ToolPak and then click on OK.
Now that the Data Analysis ToolPak is enabled, follow the steps below:
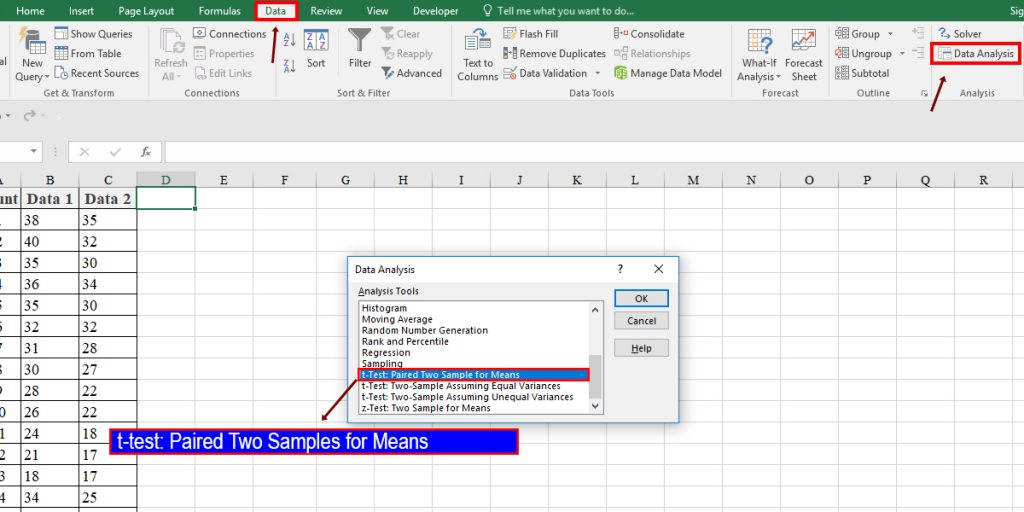
- Go to the Data tab and click on the Data Analysis from the Analysis group.
- On the Analysis Tool dialogue box that opens, choose “t-Test: Paired Two Sample for Means,” then click OK.
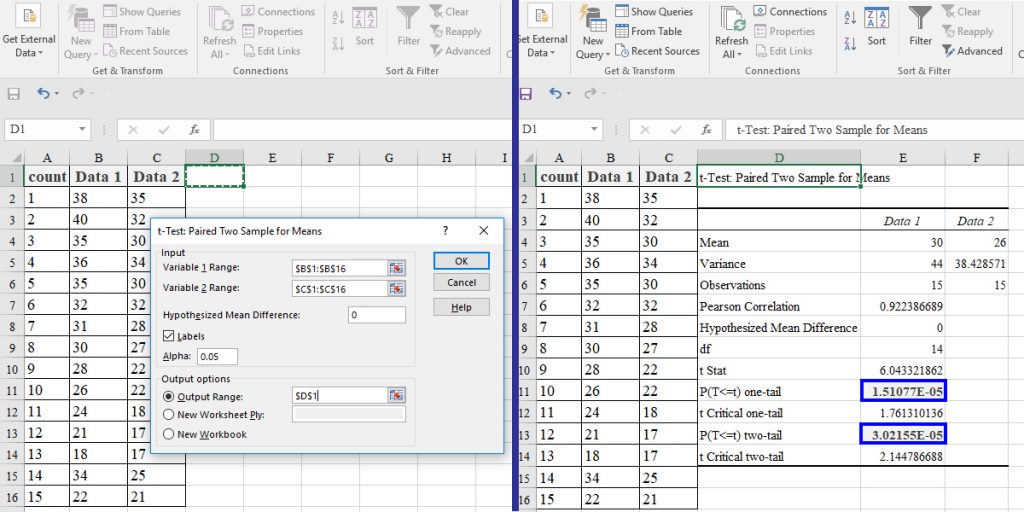
The new window includes input and output groups. The inputs include:
Variable 1 Range: This is the first dataset
Variable 2 Range: This is the second dataset
Hypothesized mean difference: This value is the null hypothesis value and represents no effect. We usually enter zero for this one.
Labels: if you have column headings, then check it.
Alpha: this is the significance level. The most common and also, Excel’s default is 0.05. Another common value is 0.01.
In the output group, we can determine where we want the results.
Look at the example below:
2. T.TEST Function
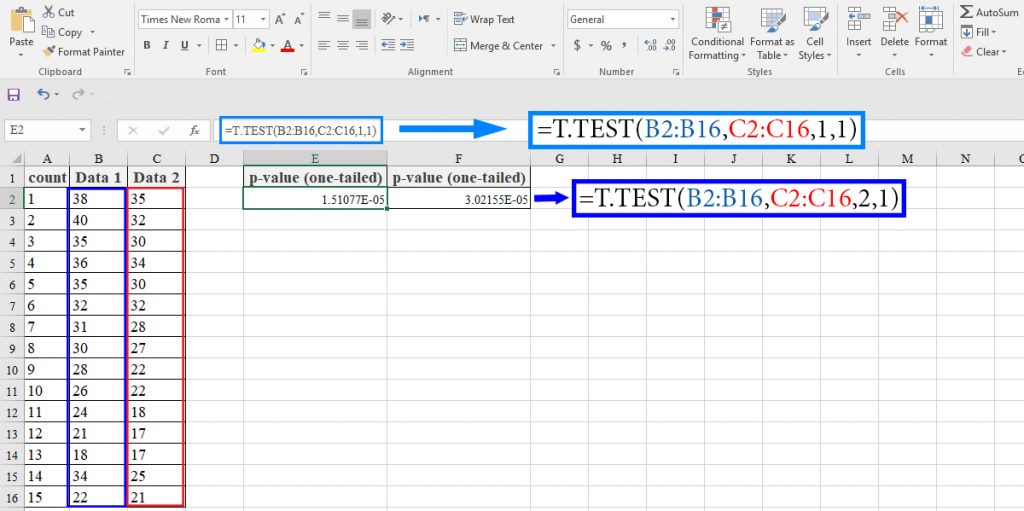
We can also perform a t-test using the T.TEST function. The syntax of the function is as below:
T.TEST(array1,array2,tails,type)
Array1: The first dataset
Array2: The second dataset
Tails: This argument determines that the function uses one or two tails of t-distribution. If it is 1, the function uses one-tailed distribution, and if it’s 2, it will use two-tailed distribution.
Type: Determines the type of t-test. There are three types of t-test:
- Paired t-test
- Two-sample equal variance t-test
- Two-sample unequal variance t-test
Look at the example below:
Possible Errors
#N/A: It occurs when the length of the arrays is not equal.
#NUM: if the supplied tails argument has any value other than 1 or 2. It also occurs if the type argument has any value other than 1, 2, or 3.
#Value: This error occurs when any of the arguments are non-numeric.
Enhance your software capabilities with our customizable Add-In Solutions, seamlessly integrating new features to meet your business needs.
Z-test
A Z-test is a hypothesis test based on the z-statistic, which follows the standard normal distribution under the null hypothesis. During a z-test, we assume that the sample distribution is normal. The z-test is based on the z-score, which is calculated with the population mean and standard deviation.
Z-test Tool from Data Analysis ToolPak
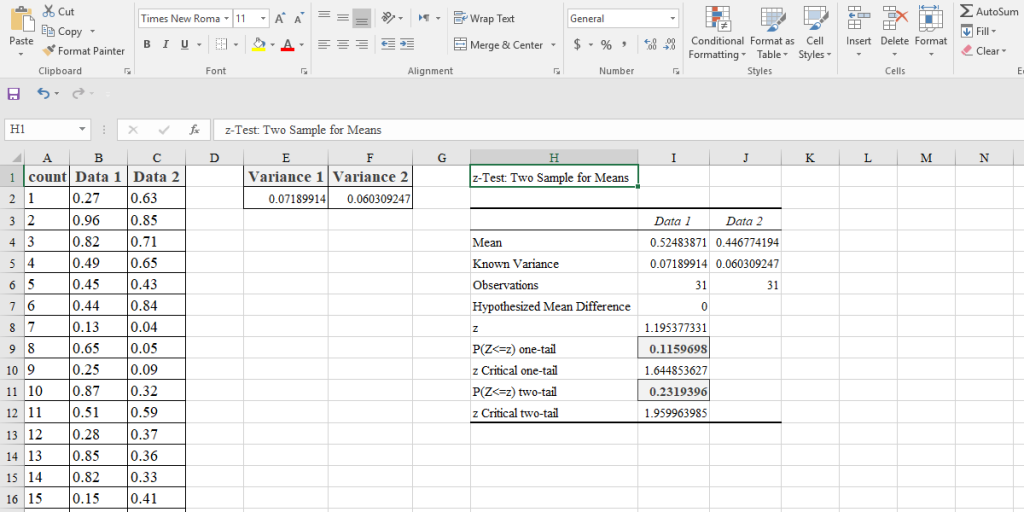
To perform a z-test using Data Analysis TooPack, go to the Data tab and click on the Data Analysis from the “Analysis” group and choose “z-Test: two samples for means” from the Data Analysis window. A new window consisting of the input variables will open. It includes:
Variable 1 Range: This is the first dataset
Variable 2 Range: This is the second dataset
Hypothesis Mean Difference: This value is the null hypothesis value and represents no effect. We usually enter zero for this one.
Variable 1 Variance (known): Variance population for the first sample.
Variable 2 Variance (known): Variance population for the second sample.
Alpha: this is the significance level. Like the t-test, the most common and also, Excel’s default is 0.05. Another common value is 0.01.
In the output group, we can determine where we want the results.
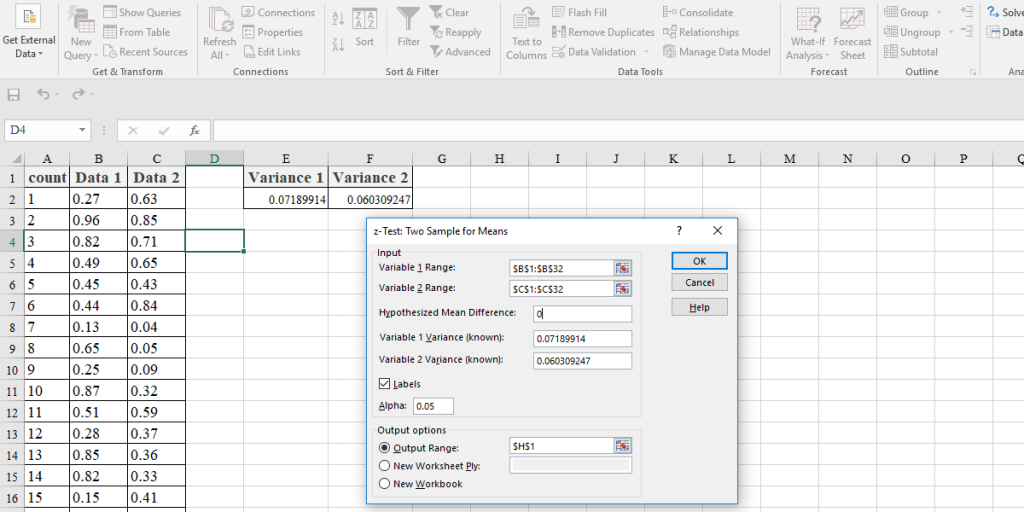
In the following image, we can see the results:
Z.TEST Function
We can also perform a z-test using the Z.TEST function. This function performs the 1-sample z-test. The syntax of the function is as below:
Z.TEST(array,x,[sigma])
Array: The dataset against which the hypothesized sample means is to be tested.
X: This is the hypothesized sample mean.
[sigma]: This is the population standard deviation (optional). If omitted, the function uses the sample standard deviation.
If we decide to calculate the two-tailed p-value, we can use the combination of the Z.TEST function and the MIN function, in the form below:
2*MIN(Z.TEST(array,x,[sigma]),1-Z.TEST(array,x,[sigma]))
Look at the following image:
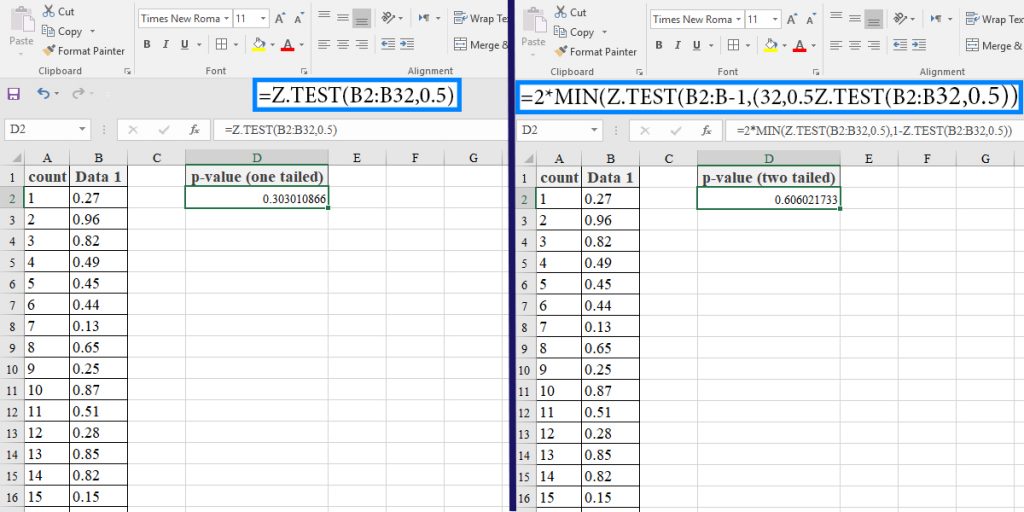
Note: The Z.TEST function calculates the one-tailed probability.
Possible Errors
#N/A: It occurs when the array is empty.
#NUM: It occurs when the [sigma] argument is equal to zero.
#DIV/0: It occurs when you do not input [sigma], and the standard deviation of the supplied array is zero. It also occurs when the array argument includes only one value.#VALUE!: It occurs when any of the inputs are non-numeric.
If you’re working with categorical data, you might also be interested in learning how to perform chi-square tests in Excel, which also involves calculating p-values.
Bottom Line
In this blog, we discussed two types of hypothesis testing: t-test and z-test. Both of these methods result in a p-value. We also introduced two ways to perform each of them.
You can connect with us and ask our experts for your inquiries and get more Excel Support Service.
Reduce cost, accelerate tasks, and improve quality with Excel Automation Service.
Our experts will be glad to help you, If this article didn’t answer your questions. ASK NOW
We believe this content can enhance our services. Yet, it’s awaiting comprehensive review. Your suggestions for improvement are invaluable. Kindly report any issue or suggestion using the “Report an issue” button below. We value your input.


