How to performe F Test in Excel: Step by Step toturial
In scientific experimentation, a common procedure is to test multiple treatments across groups—say, different production settings for different groups of the same product. This is similar to the A/B/C test, except we are dealing with measured continuous values rather than discrete counts.
This article discusses a statistical technique, called F-test (also referred to as variance ratio test) to compare variability among populations. Variance is widely used to address situations where we need to judge the consistency of a production process. Likewise, an economist might use variance to determine whether the income variability is different among two populations.
Another important use of the statistical methods we present in this article is when we wish to test or estimate the difference between the means of two independent populations. Statistics practitioners often test for the equality of variances before deciding which procedure to use for measuring if the means of the populations are equal.
The reader of this article is supposed to have a working knowledge of Microsoft Excel and must be familiar with F-distribution and hypothesis testing at its basic level. Let’s start by presenting a real-world problem.
Variability in Production Line
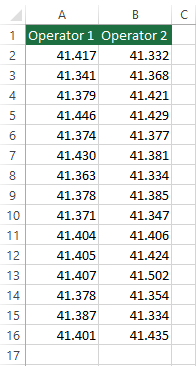
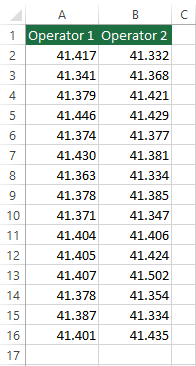
A critical component in a piece of special-purpose machinery is a steel rod that must be 41.387 cm long. The operations manager has noticed that there is a variation in the length of the steel rods. In some cases, the steel rod has to be reworked or discarded because they were either too long or too short. The operations manager believed that the rods vary from operator to operator. He organized an experiment to unravel the truth. Each of the two operators produced twenty rods. The lengths were measured and recorded in an Excel file as you can see in the following screenshot.
In the next sections, we will delineate the mathematical representation for the F-test and then perform an F-test in Excel to determine whether the operators are indeed the source of variation in the length of rods or if it is due to random chance.
F-Distribution
Let’s start with the following assumptions:
- X11, X12, …, X1n is a random sample from a normal population N(μ1 , σ12).
- X21, X22, …, X2n is a random sample from the second normal population N(μ2 , σ22).
- The two populations are independent.
We wish to test whether the two populations’ variances are equal.
Let S12 and S22 be the variances of the two samples we defined above. Then the ratio

Has an F distribution with v1 = n1 – 1 numerator degrees of freedom and v2 = n2 – 1 denominator degrees of freedom. This property is the basis for organizing and conducting hypothesis testing to evaluate the equality of two population variances.
Elevate your insights with our Data Visualization and Data Analytics Services, transforming complex data into clear, actionable strategies for your business success.
Formulating Hypothesis Testing For Equality of Variances
The F-test is a hypothesis testing method with the test statistics being f-distributed. That’s why we primarily need to formulate the null and alternative hypotheses. In the case of f-test, the null hypothesis specifies that the two variances are equal. Hence we will have;
Null Hypothesis: H0 : σ12 = σ22
Under this null hypothesis, the test statistics is;

Which is F-distributed with v1 = n1 – 1 and v2 = n2 – 1 degrees of freedom, provided that the populations have normal distributions.
Like any hypothesis testing, we can perform a left-tailed, right-tailed, or two-tailed F-test. Thus the alternative hypothesis can assume one of the following three forms each having a specific rejection criterion.
| Alternative Hypothesis Rejection Criterion H1 : σ12 ≠ σ22 f0 > fɑ/2, v1,v2 or f0 < f1-ɑ/2, v1,v2 H1 : σ12 > σ22 f0 > fɑ, v1,v2 H1 : σ12 < σ22 f0 < f1-ɑ, v1,v2 Note: In an F distribution, Fɑ/2,v1,v2= 1 / F1-ɑ/2,v1,v2 |
With the usual algebraic manipulation, we can derive the confidence interval estimator of the test statistics, F0.


At this point, we are equipped with all the tools required to perform F-test in Excel. Before that, let’s review the points we should consider while conducting F-test in Excel.
Critical Considerations Before F-Test
- The populations must have a normal distribution.
- The selection of the samples’ components should be random and independent.
- For two-tailed tests, divide alpha by 2 before finding the right and left critical values.
- If you have standard deviations, they must be squared to get the variances.
General Steps for an F Test
- State null and alternative hypothesises.
- Select alpha.
- If you are doing a two-tailed test, divide alpha by 2.
- Calculate the test statistics.
- Calculate the F critical value(s).
- Find the p-value.
- Interpret the results.
Approaches to F-Test in Excel
In this section, we will apply the F-test to find a solution to the problem we stated at the beginning of this article. That is, we wish to determine whether the operators are indeed the source of variation in the length of rods or if it is due to random chance.
There are two approaches to performing the F test in Excel.
- Using the Data Analysis ToolPak; In this approach, Excel cares for most of the steps we mentioned for the F test previously.
- Using the Excel FTEST function; this approach is substantially easier to perform but all we get from this function is a probability. This may be limiting in some situations.
In this article, we perform the F test in Excel with both approaches. Let’s start with performing F-test in Excel using the Data Analysis ToolPack.
F-Test in Excel Using the Data Analysis ToolPak
As remarked earlier, we have an Excel file containing the measurements of the steel rod lengths produced by two operators.
To perform an F-test using the Data Analysis ToolPak follow these steps;
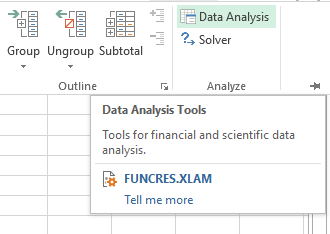
- Make sure the Data Analysis ToolPak is activated in your Excel. If this is not the case for you, go to this Microsoft Support page to install and activate the Data Analysis ToolPak.
- Go to the Data tab -> Analyze group -> click Data Analysis. This will open the Data Analysis window.
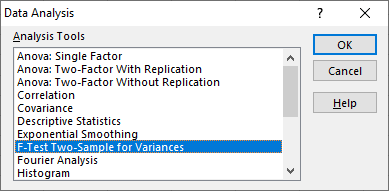
- In the Data Analysis window select F-Test Two-Sample for Variance and click OK. The F-Test Two-Sample for Variance dialog box will open.
- In the F-Test Two-Sample for Variance dialog box, select the input ranges, set a value for alpha, and an enter cell to contain the output of the F-test. If you are selecting the label of your input ranges, make sure to tick the Labels checkbox.
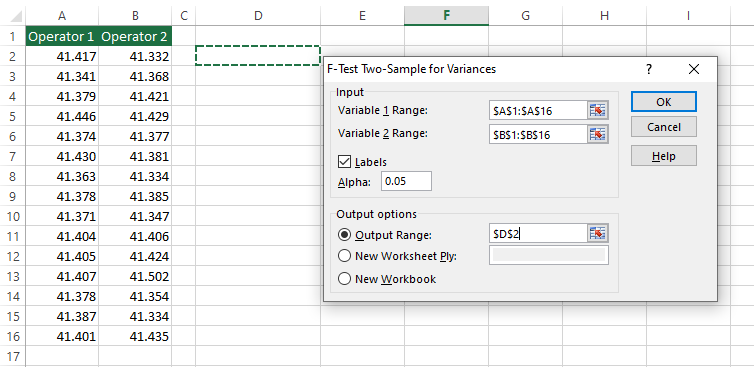
- Click OK and you will see the output appearing in the cell you selected in the Output options section in the previous step.
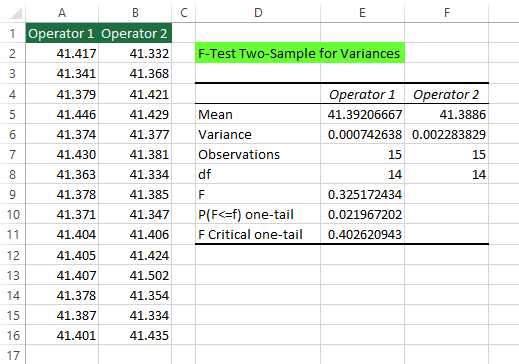
- Analyze the result.
- Mean: Mean of data corresponding to each operator
- Variance: Variance of data corresponding to each operator
- Observations: Number of observations for each operator
- df: Degrees of freedom for each operator. i.e. df = number of observations – 1
- F: Value of the test statistics (F0)
- P(F<=f): The P-value for this test. Excel outputs a one-tail p-value. Because we are conducting a two-tail test, we must double this value. So the p-value of our test will be 2*0.021 = 0.041.
- F Critical one-tail: Value of the f-distribution for v1 = 14 and v2 = 14 and alpha = 0.05. (We don’t use this value since we are performing a two-tailed F-test)
- Find the rejection region.
Since we are performing a two-tailed f-test, we have to find two F-Critical Values.
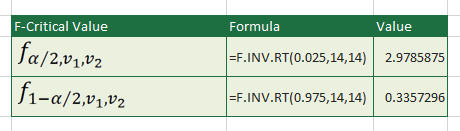
- Interpret the result.
Since the test statistics, F0 is in the rejection region, i.e.:
F0 = 0.3251 < F1-ɑ/2, v1,v2 = 0.3357
and
P-value = 0.04 < alpha = 0.05.
There is enough evidence to infer that the null hypothesis is rejected, hence the population variances differ. This means that the operators are indeed the source of variability in the rod lengths. This conclusion gives the operation manager the insight to make better decisions to eliminate the problem.
- Derive the confidence interval estimator for the test statistics, F0.
Using formulas for LCL and UCL we stated in an earlier section in Excel, we have:
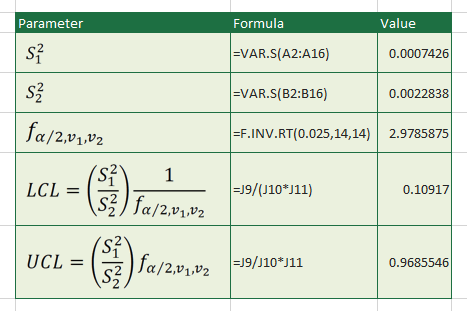
This means that with 0.95 probability, the test statistics, F0, will be in the interval [0.10917 , 0.9685546].
Empower your business with our Excel Programming and VBA Macro Development Services, tailored to automate tasks and unlock the full potential of your data management capabilities.
F-Test in Excel Using FTEST Function
F-test in Excel using the FTEST function is easy to perform and interpret. The FTEST function gets two input ranges and outputs a probability; the probability of the two populations having equal variances. Higher probabilities mean higher chances of equal variances. Let’s perform the test for the problem of variability in the production line as stated at the beginning of this article.
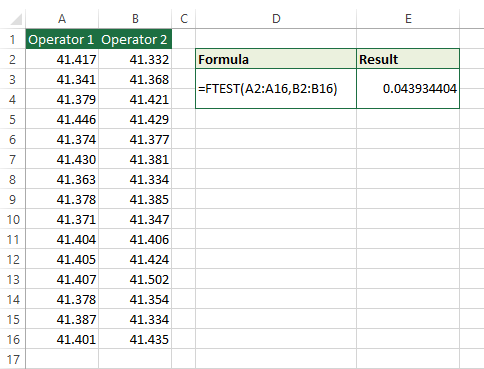
As you can see, there is only a 0.04 probability that the two populations have the same variances, which aligns with what we obtained in the previous section. That is, the variability in variances of the populations is not due to chance and operators are indeed responsible for the difference in the length of the rods.
If you’re interested in other types of hypothesis testing in Excel, check out our guide on how to perform Chi-Square tests in Excel.
Conclusion
F-test is a powerful tool that allows statistics practitioners to compare the variability of two datasets for better decision-making regarding the consistency of their processes.
In this article, we introduced the F-test, represented it in statistical terms, and applied it to solve a real-world problem in an industrial setting using Excel.
Our experts will be glad to help you, If this article didn’t answer your questions. ASK NOW
We believe this content can enhance our services. Yet, it’s awaiting comprehensive review. Your suggestions for improvement are invaluable. Kindly report any issue or suggestion using the “Report an issue” button below. We value your input.


