How To Do Chi-Square Tests in Excel?
The Chi-square test, also known as Pearson’s chi-squared test, is a hypothesis test used to draw inferences and test the relationships between one or multiple categories of variables in the form of the goodness of fit, independence, and homogeneity tests. So it’s a type of Excel data analysis and visualization. In this tutorial, we’re going to learn how to perform chi-square tests in Excel. But first, we need to learn about their applications.
Types of Chi-Square Tests
There are three types of chi-square tests:
1- Chi-square goodness of fit test
2- Chi-square test of independence
3- Chi-square test of homogeneity
What is the Chi-Square Goodness of Fit Test?
The Chi-square goodness of fit test, also referred to as Pearson’s goodness of fit test, is used to determine how well your sample data and the conclusions you make from it represent its population. Like any other hypothesis test, the goodness of fit test needs two initial hypotheses and a significance level (Alpha).
Null hypothesis (H0): The sample data is a good fit for our population.
Alternative hypothesis (Ha): The sample data is not a good fit for our population.
Alpha: It is the threshold value in the hypothesis test by which the null hypothesis can be rejected or accepted. A standard value for Alpha is 0.05.
What is the Chi-Square Test of Independence?
The Chi-square test of independence or Pearson test of independence, as the name suggests, is used to determine whether there is a relation between two groups of variables in a single population. In this test, our hypotheses are as follows:
Null hypothesis (H0): The variables in our sample data are independent of each other.
Alternative hypothesis (Ha): The variables in our sample data are related.
Boost your productivity by getting a free consultation from Excel experts, and discover tailored solutions to optimize your data management and analysis.
What is the Chi-Square Test of Homogeneity?
In the Chi-Square test of homogeneity, we are looking to see if the distribution of a single variable remains the same in multiple populations of interest. So our hypotheses in this test are:
Null hypothesis (H0): the distribution of the variable of interest is the same in all populations.
Alternative hypothesis (Ha): the distribution of the variable of interest is not the same in all populations.
Now that we have learned what each of these tests is used for, we can explain how to perform them in excel.
How to Perform Chi-Square Tests In Excel?
To perform a chi-square test in excel, as with most hypothesis tests, we need to compare the significance level with P-value. But unlike z-test and t-test, we can’t calculate the P-value for chi-square tests with the Data Analysis ToolPak add-in.
There are two ways to calculate the P-value for chi-square tests in excel, calculating the P-value by the CHISQ.DIST.RT function and calculating the P-value by the CHISQ.TEST function.
In the second approach, the P-value is calculated directly with an excel function. While it always works for chi-square tests of independence and homogeneity, it’s not always applicable for the goodness of fit test.
Let’s start with the first approach; you’ll know why when we get to the second one.
Calculating P-value By The CHISQ.DIST.RT Function
The CHISQ.DIST.RT Function
The CHISQ.DIST function in excel helps us find the P-value in the Chi-square test by using the following syntax:
CHISQ.DIST.RT(x,deg_freedom)
X: The Chi-square test statistic.
Deg_freedom: The degree of freedom.
As you can see, to find the P-value using this function, we first need to calculate the values of these two input variables.
Let’s start with the Chi-Square test statistic. Since It’s more convenient to use the CHISQ.TEST function approach for homogeneity and independence tests, we will only explain this approach for the goodness-of-fit test
Explore the full spectrum of our Microsoft Excel Services, designed to streamline operations and maximize productivity across your organization.
Step 1: Calculating The Chi-Square Test Statistic:
The formula for calculating the test statistic for the goodness of fit test:
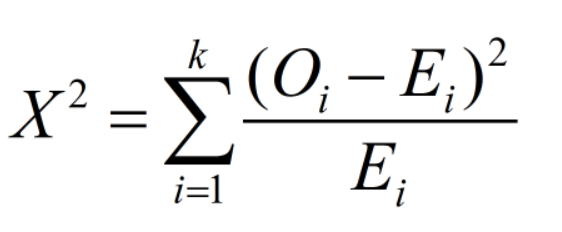
Where O and E respectively represent the observed and expected values for each cell (It’s assumed we have k rows in our data sample’s table).
Step 2: Calculating The Degree of Freedom
The formula for calculating the degree of freedom for Chi Square’s Goodness of Fit test:
Df (degree of freedom) = K (number of categories) – 1
However, if the frequencies in our sample data are distributed under a distribution with m unidentified parameters, the formula changes:
Df (degree of freedom) = K (number of categories) – m – 1
For example, if the frequencies in our sample data are distributed under Binomial distribution, which has two parameters (n,p):
m = 2
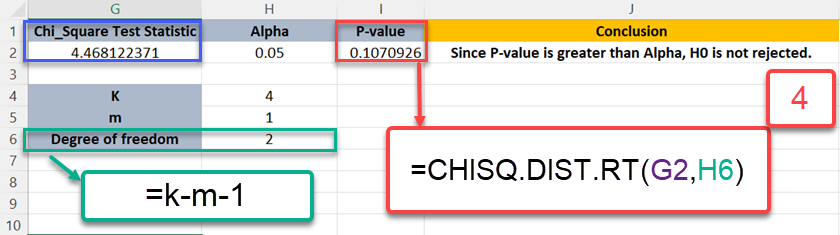
Step 3: Finding The P-value:
Now that we have calculated the chi-square test statistic and found the degree of freedom for our data, we can calculate the P-value using the CHISQ.DIST.RT function, which returns the right-tailed probability value of the chi-squared distribution.
Step 4: Comparing the P-value with Alpha:
As with all hypothesis tests, if the P-value is less than alpha, we conclude that the null hypothesis is incorrect and should be rejected.
Example of Chi Square’s goodness of fit test In Excel:
Assume we have gathered sample data from a population, and we want to see if the frequencies in our sample data are distributed under Poisson distribution with lambda equal to 0.75 (λ=0.75). In other words, we want to see if the Poisson distribution is a good fit for our sample data, so we know we should perform a goodness of fit test.
H0: The gathered data is distributed under the Poisson distribution.
H1: The gathered data is not distributed under the Poisson distribution.
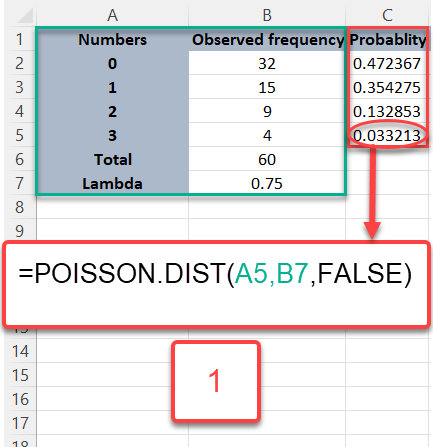
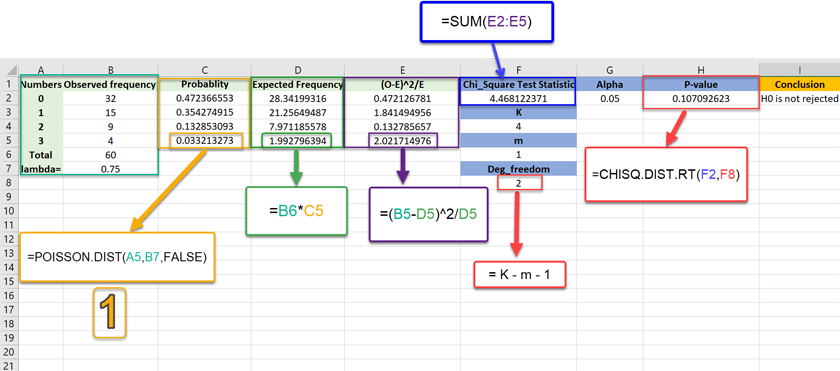
Step 1: In order to calculate the expected values, first we need to calculate the probability of each event. Here, we can use the POISSON.DIST(x, mean, cumulative) function in excel to calculate the probability of Poisson distribution, where:
x: The number of events (Column A).
mean: Lambda (λ=0.75).
cumulative: True or False. “True” returns the cumulative probability value while “False” returns the Poisson mass probability.
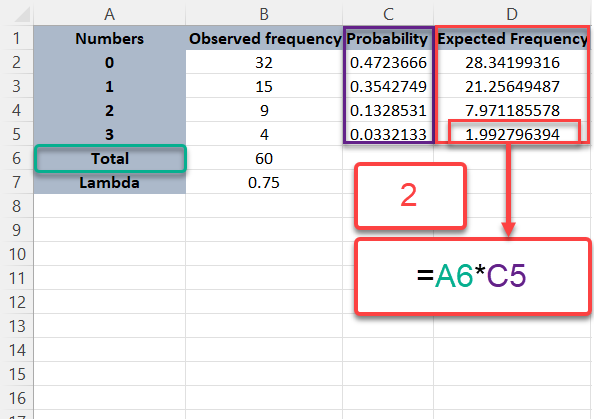
Step 2: Now that we have the value of probabilities for each event, it’s time to calculate the expected values by multiplying the total frequency by each probability like the picture below.
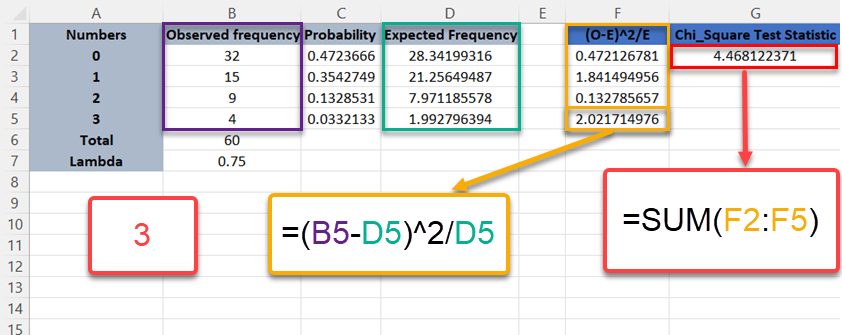
Step 3: Now, it’s time to calculate the Chi square test statistic, using its formula.
Step 4: Now for the final step, it’s time to calculate the P-value and compare it with the level of significance or Alpha. In this step, other than the Chi square test statistic, we also need to find the degree of freedom by using its formula:
K (number of categories) – m – 1
K = 4 : Since we have 4 categories.
m = 1 : Since the Poisson distribution has one parameter.
Since P-value is not less than alpha (=0.05), we can’t reject the null hypothesis (H0).
Do you need an expert Excel consultant? Contact us now!
Calculating P-value By The CHISQ.TEST Function In Excel
The CHISQ.TEST Function
The CHISQ.TEST function in Excel helps us find the P-value in the Chi-square test by using the following syntax:
CHISQ.TEST(actual_range, expected_range)
Actual range: The values that are recorded by collecting sample data.
expected_range: The values that we were expecting in our data based on the population.
Step 1: Finding the Expected Range:
The formula for calculating the expected value for the i-th row and the j-th cell is:
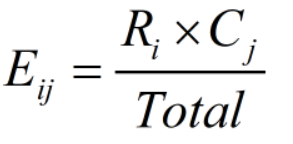
Where R and C respectively represent the i-th row total and the j-th column total values.
Step 2: Finding The P-value:
The CHISQ.TEST function we mentioned earlier enables us to directly find the P_value without manually calculating the chi-square test statistic. Still, we can’t use it to calculate the P-value when the frequencies in our sample data are distributed under a distribution with m unidentified parameters in the goodness of fit test like the example we saw earlier.
The reason for this is that the CHISQ.TEST function was originally intended for the chi-square tests of independence and homogeneity. Therefore, when the probability distribution of our data has several (m) unidentified parameters, the CHISQ.TEST function doesn’t use them in its internal implementations.
Gain expert guidance and maximize your efficiency with our Microsoft Excel Consulting Services, tailored to meet your specific business needs and challenges.
Step 3: Comparing the P-value with Alpha:
As with all hypothesis tests, if the P-value is less than alpha, we conclude that the null hypothesis is incorrect and should be rejected.
Let’s take a look at an example for finding the P-value.
Example of Chi-Square’s Test of Independence In Excel:
Suppose we have collected a data sample that consists of 2000 people (1000 females and 1000 males) and asked them about their stance on a reform bill to see whether there is a relationship between gender and the stance of people in the matter.
H0: There is no relationship between gender and political stance.H1: There is a significant relationship between gender and political stance.
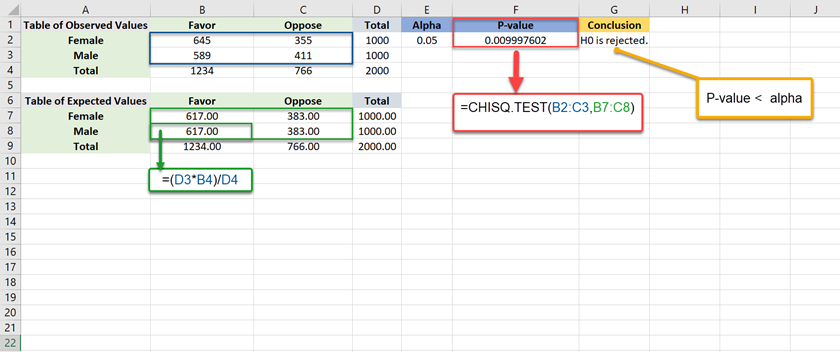
Since P-value is less than alpha (=0.05), we reject the null hypothesis (H0).
There is no difference in calculations of chi-square tests of homogeneity and independence, and the same procedure and function are used for the homogeneity test. The only difference is that in a homogeneity test, the data can be collected from more than one population to see whether a single variable’s distribution remains the same.
If you’re exploring other statistical tests in Excel, you might also be interested in learning how to perform an F-Test in Excel. The F-Test is useful when comparing the variances of two datasets and is commonly used before running a t-test. Understanding both the Chi-Square test and the F-Test can give you a broader toolkit for statistical analysis in Excel.
Conclusion
If you have read this blog so far, now you know what the chi-square test is and how to perform different types of it in Excel. I explained two methods. The CHISQ.TEST function approach would always work for the independence and homogeneity test. The CHISQ.DIST.RT Function approach is a more in-depth statistical method that ensures the goodness of fit test is done correctly.
Our experts will be glad to help you, If this article didn’t answer your questions. ASK NOW
We believe this content can enhance our services. Yet, it’s awaiting comprehensive review. Your suggestions for improvement are invaluable. Kindly report any issue or suggestion using the “Report an issue” button below. We value your input.


