How To Use LINEST Function In Excel
In statistical modeling, regression means studying the relationship between a variable (dependent variable) and one or more variables (independent variable). Among Excel statistical functions, the LINEST function is used for linear regression calculations. In this blog, we are going to introduce the LINEST function and discuss how it works.
Introduction to Linear Regression
As mentioned above, in linear regression, we have an independent variable and a dependent variable, so we seek to examine the relationship between the dependent and independent variables. The use of linear regression is to estimate the value of the dependent variable using the independent variable and the regression equation.
If we have one independent variable, the regression is called simple linear regression, but when we have more than one independent variable, it is called multiple linear regression.
The equation for the simple linear equation is:
y=mx+b
In this equation, m is called “slope” and b is called “intercept.”
The equation for multiple linear regression is:
y=m1x1+ m2x2+…+mnxn+b
Unlock valuable insights with our Data Visualization and Data Analytics Services, transforming complex data into clear, actionable strategies for informed decision-making.
LINEST Function
In Excel, the LINEST function is used to do linear regression. The LINEST function uses the least square method to do linear regression calculations. The syntax for the LINEST function in Excel is as follows:
LINEST(known_y’s,[known_x’s],[const],[stats])
known_y’s: The dependent values of the line equation (y values).
[known_x’s]: The independent values of the line equation (x values). This argument is optional. If omitted, Excel assumes the dataset is {1,2,3,…} with the same size as y values.
[const]: This is the function’s logical argument, which says how the intercept should be treated (optional). 1 is TRUE and means that b should be calculated normally. 0 is FALSE and means that b should be considered TRUE. If omitted, Excel will consider it as zero.
[stats]: This a logical argument too. 1 is TRUE and means that Excel will return the statistical parameters. 0 is FALSE and means that Excel will not calculate the statistical parameters.
Note: For the logical arguments, you can type TRUE or FALSE, too.
The LINEST function returns an array of the statistical parameters which, includes:
| Parameter | Description |
|---|---|
| mi | The slope related to the ith variable |
| b | The intercept of the line (the constant value of y when x=0) |
| sei | The standard error values for slope coefficients (mi) of independent variables (xi) ( It is also called the uncertainty of slope) |
| seb | The standard error value for constant b. (It is also called the uncertainty of intercept)Note: If the [const] variable is zero, returns #N/A error |
| r2 | The constant of determination |
| sey | The standard error for y estimate |
| F | F statistic, or the F-observed value |
| df | Degrees of freedom |
| ssreg | The regression sum of squares |
| ssresid | The residual sum of squares |
Since the LINEST function returns an array of outputs, it must be entered as an array formula using Ctrl+Shift+Enter shortcut.
Now let’s see how the LINEST function works for simple and linear regression:
Simple Linear Regression
In this example, we are going to calculate the slope, the intercept, and the statistical values for a dataset, including x and y values. To do the calculation:
- Select a range consisting of 2 rows and 5 columns.
- Type the syntax of the function
- Press Ctrl+Shift+Enter
The result will appear.
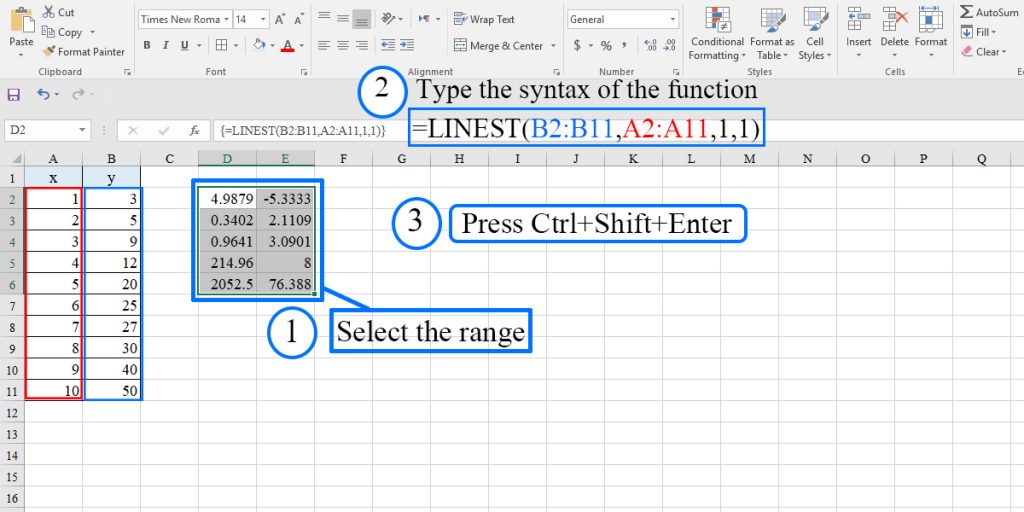
The order of data the LINEST function returns is as follows:
| m (the coefficient of slope) | b (the coefficient of intercept) |
| se | seb |
| r2 | sey |
| F | df |
| ssreg | ssresid |
Note1: If you do not need the statistical parameters, just put zero for the last argument. In this case, you must select a range of two cells in one row.
Note2: If you do not enter the function as an array or select only one cell and type the formula, the function will only return the slope coefficient (m).
If you need to calculate an unknown y value corresponding to an x value, you will have two choices. The first way is to put the slope and intercept that the LINEST function returns in the line equation. The second way is to combine the LINEST function with the SUM function.
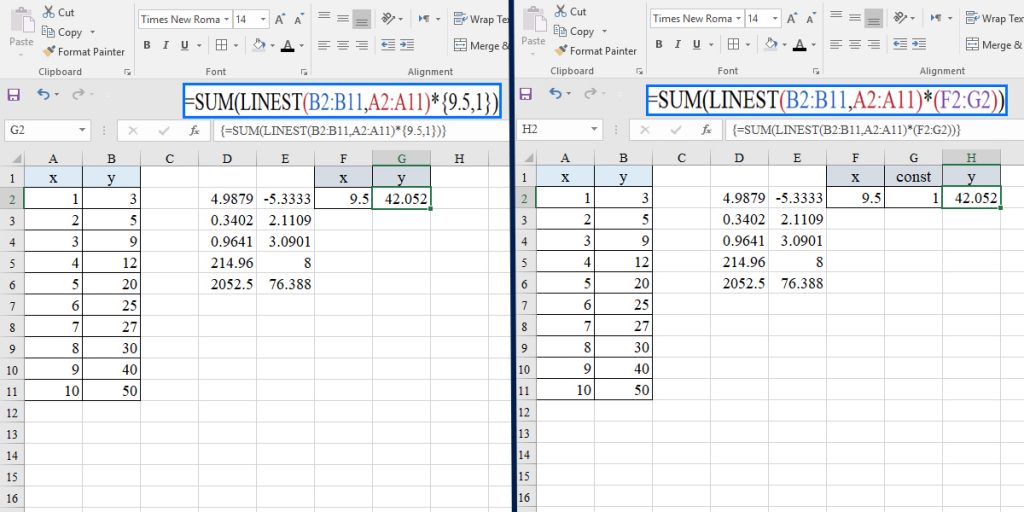
To use the second way for this example, you should type the following formula in an Excel cell and then press Ctrl+Shift+Enter.
=SUM(LINEST(B2:B11,A2:A11)*{45,1})
Note: If you need to enter the x value that you want to know its corresponding y value from a cell, you must enter the constant 1 in a cell too. Look at the image below:
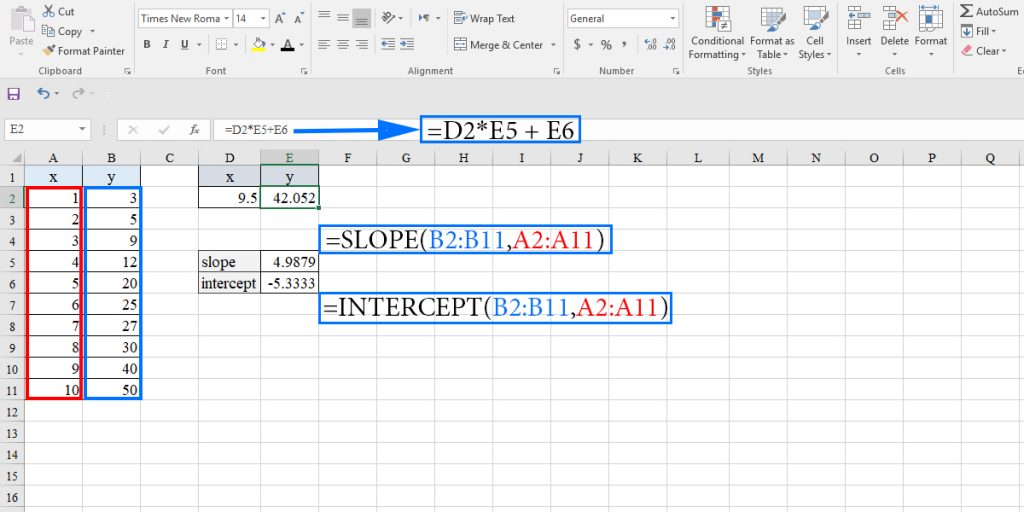
SLOPE and INTERCEPT Functions
If you demand to find only the slope or intercept of the data, there is an alternate method. The SLOPE function is used to calculate the slope of the linear regression equation, and the INTERCEPT function is used to calculate the intercept of the linear regression equation. The syntax of these functions is as bellows:
SLOPE(known_y’s,known_x’s)
INTERCEPT(known_y’s,known_x’s)
known_y’s: The dependent values of the line equation (y values).
known_x’s: The independent values of the line equation (x values).
In the example below, we have calculated the slope and intercept of the regression line in E5 and E6 cells, respectively. Then we calculated the y value corresponding to x=9.5.
Boost your productivity by getting a free consultation from Excel experts, and discover tailored solutions to optimize your data management and analysis.
Note: The algorithm that the SLOPE and INTERCEPT functions use to calculate the slope and intercept are different from the algorithm used by the LINEST function, so that’s why you might see a difference in the slope value of a dataset using these functions.
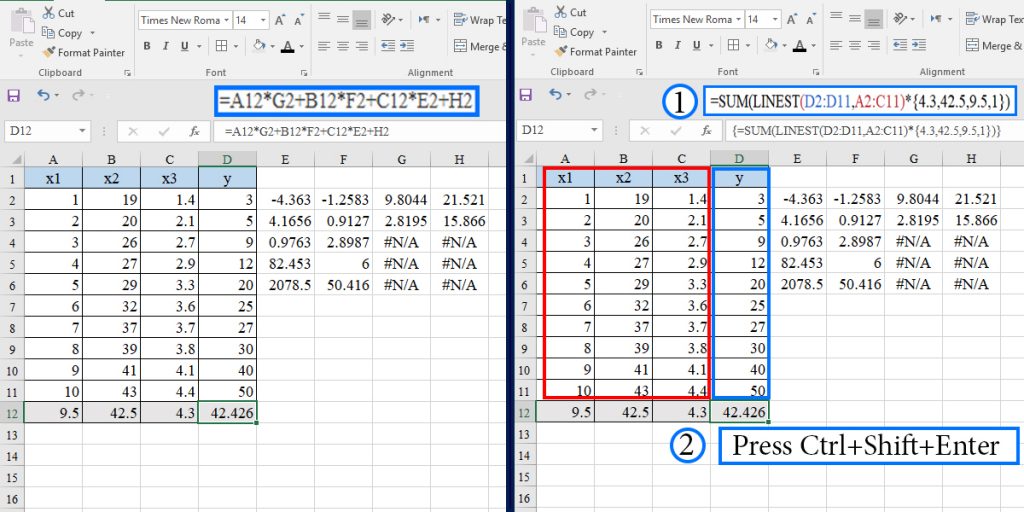
In this example, we use the LINEST function to do multiple linear regression. The only difference between multiple and linear regression is the cells we select. If we have n datasets of x values, we should select (n+1) rows and 5 columns (in case we need the statistical parameters).
The order of parameters that the LINEST function returns is as follows:
| mn | mn-1 | … | m1 | b |
| sen | sen-1 | … | se1 | seb |
| r2 | sey | – | – | – |
| F | df | – | – | – |
| ssreg | ssresid | – | – | – |
In the empty cells, Excel will return the #N/A error. It is the default behaviour of the LINEST function.
For this example:
- Select a range consisting of 4 rows and 5 columns.
- Type the syntax of the function.
- Press Ctrl+Shift+Enter
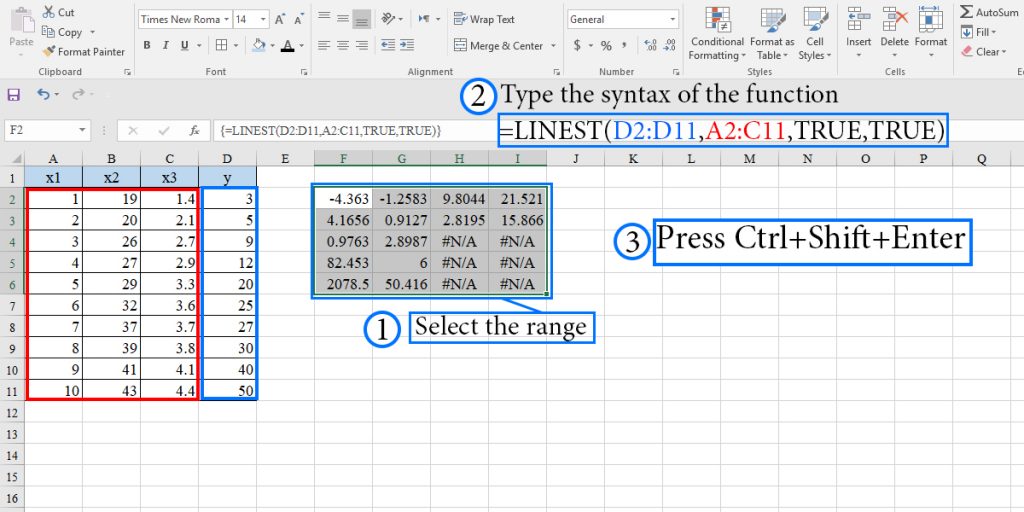
Attention: As you can see, the LINEST function returns the slopes and standard error of the slope in reverse order.
Note: If you do not need the statistical parameters, just put zero for the last argument. In this case, you must select a range of 4 cells in one row.
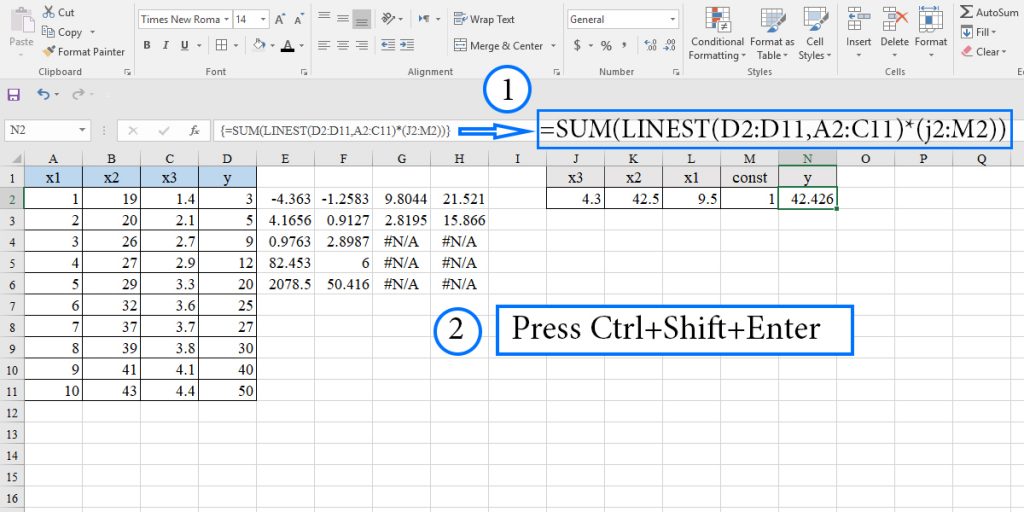
If you demand to calculate an unknown y value corresponding to a set of x values, you can use the two methods mentioned in the previous example. If you want to use the combination of the LINEST and SUM functions, you have to type the x values in the reverse order. Look at the image below:
Note: You can use the same method we introduced for the simple linear regression to enter the x values in cells.
Once you have your regression model from LINEST, you can use it to predict or extend values beyond your current dataset. Learn more about this process in our guide on how to extrapolate in Excel.
Possible Errors
#REF!: This error will occur if the size of the first and second data sets is not equal.
#VALUE: This error occurs when each one of known_x’s and known_y’s has non-numeric values. It could be blank or text. It also occurs when the input for [const] or [stats] can not be evaluated to TRUE or FALSE.
Visit What are Excel Formula Errors? to learn more about errors in Excel.
Bottom Line
The LINEST function is a tool for calculating linear regression. So when you want to use the LINEST function, make sure that your data are close to linear. The uncertainty values and the other statistical parameters can help you determine the accuracy of the equation and whether or not the function fits the data.
You can connect with us, contact our experts if you have any inquiries, and get more support via Excel Support Services.
Also, reduce costs, accelerate tasks, and improve quality with Excel Automation Services.
Our experts will be glad to help you, If this article didn’t answer your questions. ASK NOW
We believe this content can enhance our services. Yet, it’s awaiting comprehensive review. Your suggestions for improvement are invaluable. Kindly report any issue or suggestion using the “Report an issue” button below. We value your input.


