Using Excel to Enhance Employee Performance Analysis
- Unlock the Power of Excel for Employee Performance Analysis in HR
- Why Employee Performance Analysis Matters in HR
- Setting Up Data for Excel for Employee Performance Analysis
- Using Key Excel Functions for Performance Analysis
- Building Visual Dashboards to Track Employee Performance
- Tracking KPIs and Benchmarking Performance
- Automating Performance Analysis for Efficiency
- Use Cases of Excel for Performance Analysis
- Best Practices for Using Excel in Performance Analysis
- Conclusion on Excel for Employee Performance Analysis
Unlock the Power of Excel for Employee Performance Analysis in HR
Data-driven decision-making has become a cornerstone of effective human resource management. HR teams now embrace data to optimize their workforce and drive organizational success.
Data-driven performance analysis allows HR professionals to gain valuable insights into employee performance, identify areas for improvement, and make informed decisions about promotions, training, and retention.
Excel, a versatile and readily available tool, is a powerful ally in this quest. Its robust features for data organization, visualization, and automation empower HR teams to unlock the potential of their data.
This guide explains how to utilize Excel to enhance HR strategies, enabling you to improve your HR performance analysis and foster positive change within your organization.
Why Employee Performance Analysis Matters in HR
Employee performance analysis plays a vital role in modern HR, providing the data-driven insights needed to optimize workforce effectiveness. It serves several key purposes:
Understanding Workforce Strengths
Performance analysis helps identify employees’ core strengths and areas of expertise. This knowledge allows HR to:
- Leverage talent effectively: Assign employees to projects and roles that best utilize their skills.
- Recognize and reward high performers: Identify top talent and implement appropriate recognition programs.
- Build strong teams: Create balanced teams with complementary skill sets.
Identifying Areas for Improvement
Analyzing performance data can highlight areas where employees may need additional support or development. This allows HR to:
- Address skill gaps: Identify training needs and implement targeted development programs.
- Provide constructive feedback: Offer specific and actionable feedback to help employees improve.
- Prevent performance issues: Proactively address potential problems before they escalate.
Supporting Employee Development
By understanding individual strengths and weaknesses, HR can create personalized development plans that empower employees to grow and succeed. This includes:
- Tailored training programs: Design training initiatives that address specific skill gaps and development needs.
- Mentorship and coaching: Pair employees with mentors or coaches to provide guidance and support.
- Career development opportunities: Identify opportunities for employees to advance within the organization.
Data-Backed Decision-Making
Data-driven insights from performance analysis are essential for making informed decisions about:
- Promotions: Identify high-performing employees with the potential to take on greater responsibilities.
- Training: Allocate training resources effectively based on identified needs.
- Workload distribution: Ensure fair and balanced workloads across teams and individuals.
Ultimately, effective employee performance analysis empowers HR to create a more engaged, productive, and successful workforce, driving organizational success.
Setting Up Data for Excel for Employee Performance Analysis
To conduct a comprehensive performance analysis, HR teams should gather and organize relevant data in Excel. Here’s a step-by-step guide:
Data Collection
To conduct a comprehensive performance analysis, HR teams should gather a variety of data points. Important information to collect includes:
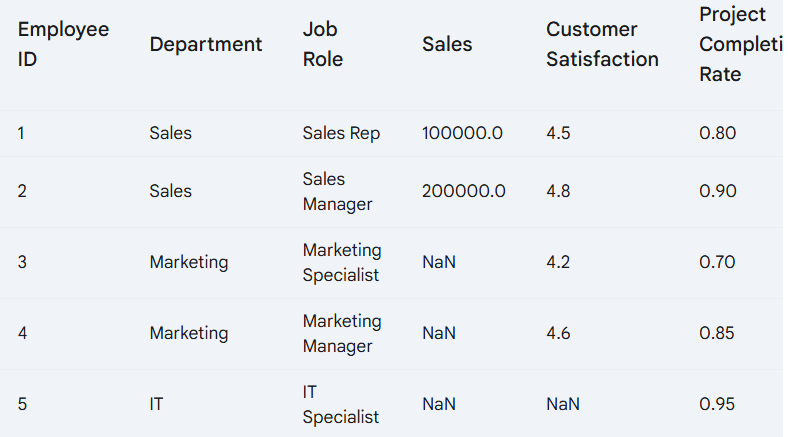
- Key Performance Indicators (KPIs): Specific metrics that measure employee performance, such as sales figures, customer satisfaction ratings, and project completion rates.
- Attendance Records: Data on employee attendance, which includes punctuality, absenteeism, and time-off requests.
- Project Completion Rates: Information on how efficiently employees complete tasks and projects.
- Feedback Scores: Ratings from managers, peers, and subordinates on various aspects of performance.
Collecting this data provides a thorough overview of each employee’s performance.
Data Structuring
Once the data is collected, it’s essential to organize it in a clear and concise manner. Structured data simplifies analysis and visualization.
Here are some best practices for structuring data in Excel:
- Create a Table: Organize your data into a table format, with each row representing an employee and each column representing a specific metric.
- Use Clear Headings: Assign clear and concise headers to each column to easily identify the data.
- Apply Data Validation: Use data validation to ensure data consistency and accuracy. For example, you can restrict the input values for certain columns to specific formats or ranges.
- Format Data: Format your data appropriately to improve readability. Use number formats for numerical data, date formats for dates, and text formats for textual data.
Data Cleaning
Before analyzing your data, it’s crucial to clean it to ensure accuracy and reliability. So, eliminate duplicates, fix errors, and standardize inputs to ensure your analysis is accurate and reliable. Here are some tips for data cleaning:
- Remove Duplicates: Identify and remove any duplicate entries in your data.
- Check for Errors: Review the data for errors, such as typos or inconsistencies.
- Handle Missing Values: Decide how to handle missing values, such as removing the rows or imputing values based on other data points.
- Use Excel Functions: Utilize Excel functions like TRIM and CLEAN to remove extra spaces and non-printable characters.
- Normalize Data: If necessary, normalize your data to ensure consistency and comparability.
Creating a well-structured and clean dataset is crucial for accurate analysis.
Using Key Excel Functions for Performance Analysis
Excel offers a variety of functions to analyze and summarize performance data. Here are some key functions to consider:
Basic Functions
Basic functions in Excel provide a quick overview of performance metrics. To summarize and analyze performance data, Excel includes several essential functions:
- AVERAGE: Calculates the average value of a range of cells.
- SUM: Adds up the values in a range of cells.
- COUNTIF: Counts the number of cells within a range that meet a given criterion.
For example, to calculate the average performance score of a team, you can use the AVERAGE function. To determine the total number of employees who met a specific target, you can use the COUNTIF function.
Advanced Analysis
Excel’s advanced functions allow for more complex analysis:
- IF Statements: Create conditional statements to perform different calculations based on specific criteria. For example, you can use an IF statement to assign a performance rating based on a score range.
- VLOOKUP/HLOOKUP: Search for specific values in a table and return corresponding values from another column or row. This can be useful for looking up employee information based on their ID number.
- INDEX-MATCH: A more flexible alternative to VLOOKUP and HLOOKUP, allowing you to reference data from different sheets or workbooks.
- Conditional Formatting: Highlight cells based on specific criteria, such as highlighting top performers or employees requiring additional support.
Trend Analysis
Trend Analysis enables HR teams to predict and respond to performance fluctuations. To identify trends in performance data, you can use the following functions:
- Excel TREND: Calculates the linear trend of a set of data points.
- Excel FORECAST: Predicts future values based on historical data.
HR teams can identify patterns, anticipate future performance, and make data-driven decisions by analyzing trends. For example, you can use the TREND function to forecast future sales performance based on past data.
For HR professionals looking to dive deeper into leveraging Excel for employee management, Excel tips for HR can offer additional insights on improving HR operations and streamlining tasks.
Building Visual Dashboards to Track Employee Performance
Creating Excel dashboards for employee performance allows you to transform raw data into actionable insights. Here’s how you can create them:
Using Pivot Tables
Pivot tables are a powerful tool for summarizing and analyzing large datasets, allowing for quick comparisons and highlighting patterns.
By creating pivot tables, you can easily categorize and summarize employee performance data based on various dimensions, such as department, team, or job role.
This enables the identification of trends, outliers, and areas for improvement.
- Organize Data: Start by creating a well-structured table with columns for employee names, key performance indicators (KPIs), and performance ratings.
- Create Pivot Tables: Utilize Pivot Tables to summarize data by department, role, or time period.
- Analyze Data: Drill down into specific data segments to uncover trends and patterns.
Charts for Visualization
To effectively analyze and present your data, it’s important to choose the right chart types. Here are some suggestions:
- Bar Charts: These are excellent for comparing performance metrics across different categories, such as departments or teams.
- Line Charts: Ideal for tracking performance trends over time, such as sales figures or employee satisfaction scores.
- Radar Charts: Useful for comparing multiple performance metrics for an individual or team simultaneously.
These chart types can create visually appealing dashboards that make complex data easier to understand.
Interactive Dashboards
Interactive Excel dashboards for employee performance enhance data visualization by incorporating slicers and filters, allowing users to explore data dynamically. This functionality enables users to customize their views based on specific needs, such as filtering data by department, job role, or time period.
Such features empower HR teams to gain insights into particular areas of interest quickly.
Here are some tips for creating effective interactive dashboards:
- Keep it Simple: Avoid cluttering your dashboard with too much information. Focus on the key metrics that are most relevant to your analysis.
- Use Clear and Concise Labels: Ensure that your charts and tables are easy to understand.
- Choose the Right Chart Type: Select chart types that are appropriate for the type of data you are visualizing.
- Test and Iterate: Continuously test and refine your dashboard to ensure it meets the needs of your users.
By leveraging the power of Excel’s data visualization tools, you can create engaging and informative dashboards that help HR teams make data-driven decisions.
Tracking KPIs and Benchmarking Performance
Defining relevant KPIs is vital for effective analysis. Metrics like productivity, punctuality, and project outcomes should align with your organization’s goals.
Excel simplifies benchmarking by comparing individual scores against departmental averages or pre-set targets. Conditional formatting can visually highlight whether employees meet or exceed benchmarks, making insights easy to grasp.
Defining KPIs
Key Performance Indicators (KPIs) are quantifiable measures that help assess an organization’s performance. When selecting KPIs for employee performance analysis, consider your organization’s specific goals and objectives. Here are some common KPIs:
- Productivity Metrics:
- Lines of code written per hour
- Sales per week/month
- Units produced per hour
- Quality Metrics:
- Defect rates
- Customer satisfaction scores
- Error rates
- Efficiency Metrics:
- Time to complete tasks
- Resource utilization
- Financial Metrics:
- Revenue generated
- Cost savings
- Behavioral Metrics:
- Teamwork
- Communication skills
- Problem-solving abilities
Once you’ve identified relevant KPIs, define specific, measurable, achievable, relevant, and time-bound (SMART) goals for each employee.
Benchmarking Performance
Benchmarking involves comparing an organization’s performance against industry standards or internal best practices. Excel can be a powerful tool for benchmarking employee performance:
- Set Benchmarks: Establish clear benchmarks for each KPI. These can be based on industry averages, historical data, or best practices.
- Calculate Performance Metrics: Use Excel functions to calculate relevant metrics for each employee, such as average productivity, average customer satisfaction, or average project completion time.
- Compare Performance: Compare individual and team performance to the established benchmarks. Use Excel’s conditional formatting to highlight underperforming or overperforming employees.
- Identify Opportunities for Improvement: Use the benchmarking data to identify areas where employees can improve their performance.
By using Excel for benchmarking, HR teams can gain valuable insights into their workforce’s performance and identify areas for improvement.
Automating Performance Analysis for Efficiency
Automation saves time and reduces errors in performance analysis. To streamline your performance analysis process, consider these powerful tools:
Using Macros
Excel’s macro functionality can significantly streamline your performance analysis process by automating repetitive tasks. By recording a series of actions, you can create a macro to execute those actions automatically. For example, you can create a macro to:
- Generate Monthly Reports: Automatically filter and format data to create monthly performance reports.
- Calculate KPIs: Perform complex calculations, such as weighted averages or weighted sums.
- Format Data: Apply consistent formatting, such as fonts, colors, and number formats, to your data.
Power Query
Power Query, a powerful data integration and transformation tool, can help HR teams consolidate data from multiple sources, such as HR systems, spreadsheets, and databases.
This allows you to create a unified view of employee performance data, making analysis more efficient and accurate.
With Power Query, you can:
- Combine Data from Multiple Sources: Merge data from different sources into a single dataset.
- Clean and Transform Data: Remove duplicates, handle missing values, and format data.
- Shape and Reshape Data: Pivot tables, unpivot columns, and apply other data transformations.
- Load Data into Excel: Load the transformed data into Excel for further analysis and visualization.
By automating repetitive tasks and streamlining data integration, you can save time and improve the efficiency of your performance analysis process.
Use Cases of Excel for Performance Analysis
Excel offers HR professionals a robust platform for performance analysis. Key use cases include:
- Streamlining Performance Reviews: Centralizing data, automating calculations (averages, trends), and ensuring consistent performance criteria application.
- Identifying High-Potential Employees: Tracking KPIs, analyzing skill gaps, and supporting succession planning.
- Analyzing Training Effectiveness: Measuring training outcomes by comparing pre- and post-training performance, identifying training needs, and optimizing resource allocation.
- Improving Employee Engagement: Analyzing satisfaction survey data, monitoring engagement metrics (absenteeism, turnover), and identifying root causes of low engagement.
- Workload Optimization: Analyzing workload distribution to identify bottlenecks and over/underutilization, and adjusting staffing levels accordingly.
These are just a few examples of how Excel can be used to enhance HR performance analysis. By leveraging its capabilities, HR professionals can make more informed decisions, improve employee engagement, and drive organizational success.
Best Practices for Using Excel in Performance Analysis
To maximize the effectiveness of Excel in performance analysis, consider these best practices:
- Data Quality and Integrity:
- Keep Data Up-to-Date: Regularly update your data to ensure accuracy and relevance.
- Validate Data: Use data validation to ensure data accuracy and consistency.
- Clean Data: Remove duplicates, errors, and inconsistencies.
- Data Security and Privacy:
- Protect Sensitive Information: Implement security measures to protect sensitive employee data.
- Encrypt Data: Use encryption to safeguard confidential information.
- Control Access: Limit access to sensitive data to authorized personnel.
- Organization and Backup:
- Organize Files: Create a clear and organized file structure to easily locate and manage your files.
- Backup Regularly: Regularly back up your Excel files to prevent data loss.
- Version Control: Use version control to track changes and revert to previous versions if needed.
- Continuous Learning and Improvement:
- Stay Updated: Keep up-to-date with the latest Excel features and functions.
- Seek Training: Attend training courses or workshops to enhance your Excel skills.
- Experiment and Learn: Explore different techniques and approaches to find the best way to analyze your data.
By following these best practices, you can ensure that your Excel-based performance analysis is accurate, efficient, and secure.
For tasks requiring advanced functionalities beyond the scope of basic Excel features, consider seeking professional assistance from Excel consulting services like Bsuite365. These services can provide expertise in areas like macro creation, data automation, custom add-ins, and complex data analysis techniques.
Conclusion on Excel for Employee Performance Analysis
Excel is a powerful tool for HR teams aiming to elevate performance analysis and workforce management. Its versatility allows professionals to transform raw data into actionable insights, enabling smarter decision-making and fostering growth.
By leveraging Excel’s robust features—such as data organization, trend analysis, and automation—HR teams can simplify complex tasks, uncover trends, and enhance overall efficiency. These capabilities empower organizations to monitor and improve employee performance effectively.
By using Excel, HR professionals can monitor performance metrics, track progress toward goals, and identify areas for development. Whether it’s through tracking attendance, project completion, or feedback scores, Excel provides clarity and insight into employee productivity.
For a broader perspective on how Excel can support HR departments in managing and analyzing workforce data, explore our post on Excel Consulting for HR Data Management and Analytics.
Start utilizing Excel’s potential today to take your HR analytics to the next level and unlock new opportunities for your team’s success.
If you need more help, contact our specialized Excel consultants at Bsuite365 for tailored solutions and expert guidance!
Our experts will be glad to help you, If this article didn’t answer your questions. ASK NOW
We believe this content can enhance our services. Yet, it’s awaiting comprehensive review. Your suggestions for improvement are invaluable. Kindly report any issue or suggestion using the “Report an issue” button below. We value your input.

