Excel Spreadsheet-What Users Should Know
“The global economy is built on two things: the internal combustion engine and Microsoft Excel. Never forget this.”
— Kevin Hector, Twitter
The quote simply says it all. Some say the business world has a love/hate relationship with spreadsheets. That’s Because spreadsheet programs are one of the most commonly used software around the world.
There are different spreadsheet software and applications available on the market today. However, MS Excel and google sheets are currently very popular.
The spreadsheet is probably the first thing you see once you open the Excel programme. Did you know that the spreadsheet has its own terminology? Starting with ‘Absolute cell reference’ and finishing with ‘Worksheet’.
This goes to show how powerful and in demand spreadsheets are. But what is a spreadsheet exactly, and what does it do?
What is a Spreadsheet?
One way to define something is to look at it comparatively. In other words, to find differences and similarities by comparing it to something else. However, before diving into compare and contrast, let’s see how a spreadsheet has been defined. We managed to extract two brief definitions of the spreadsheet.
“A spreadsheet is a software used to perform mathematical calculations on data. It is also used to generate reports and data visualization.”
“A spreadsheet is made up of rows and columns. Columns are vertical and rows are horizontal. It is used to calculate, store and sort different types of data.”
In the next part, we are going to compare a Spreadsheet with a Worksheet, Workbook, Database, and Table. Our aim is not only to gain a better understanding of the Spreadsheet but also to answer some common questions.
Spreadsheet Vs. Database
Databases handle huge volumes of complex data. Whereas the spreadsheet has record limitations, this means you are able to see the data at a glance. The data in a spreadsheet is stored in a cell which can be manipulated, edited and formatted within that cell. So, a spreadsheet is different in the way it stores data which might be more static compared to a database which is more relational. For instance, a database can contain records from external tables and accommodates many sorts of data. Remember these two terms might be used interchangeably, yet they have their differences, and each has its functions, pros, and cons.
Spreadsheet Vs. Worksheet
A spreadsheet is also called a worksheet. The worksheet is the grid on which you fill in the information. Simply put, a worksheet is a single spreadsheet. It is made up of several rows and columns. So, the spreadsheet can be a collection of worksheets. As mentioned before, both these terms are used interchangeably since they are known to be close in how they are defined.
Spreadsheet Vs. Workbook
Considering the above definition, a workbook is formed by a combination of separate spreadsheets. So when you open the Excel program, you are actually opening a workbook. Therefore, an Excel workbook consists of multiple spreadsheets which are almost independent. The workbook manages data with a larger purpose in mind. Whereas a worksheet is used to enter and manage data.
Spreadsheet Vs. Table
The structure of the table is similar to a spreadsheet; it has columns and rows. Tables are within a spreadsheet and are a collection of cells; they can be named and called into a formula. Spreadsheets, on the other hand, store individual data, charts, tables, formulas, macros, named ranges, etc.
Basics of Spreadsheet Layout
Basically, a file in Excel is known as a “Workbook”. However, let’s start with the most primary element of the spreadsheet which is the “Cell” and then move on to “Workbook”.
Below you can see important features of a spreadsheet explained and highlighted.
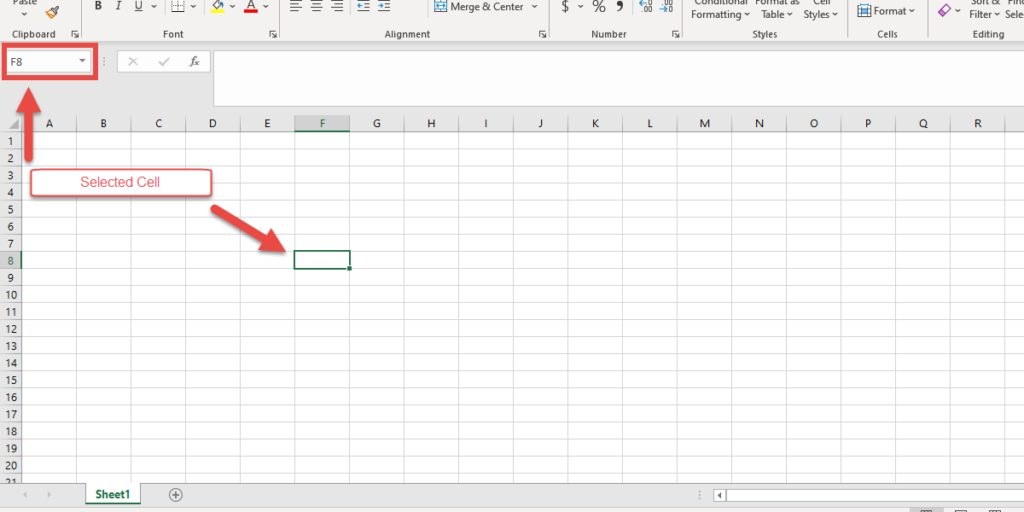
Selection of a Cell
The image shows a Cell, which is also called an ‘Active Cell’. As you can see, cell F8 has been selected. Therefore, a cell is labeled based on its placement. In this case, the F8 cell, where “F” refers to its column name, and “8” shows its row number. You can record different types of data in a cell which we will further discuss below.
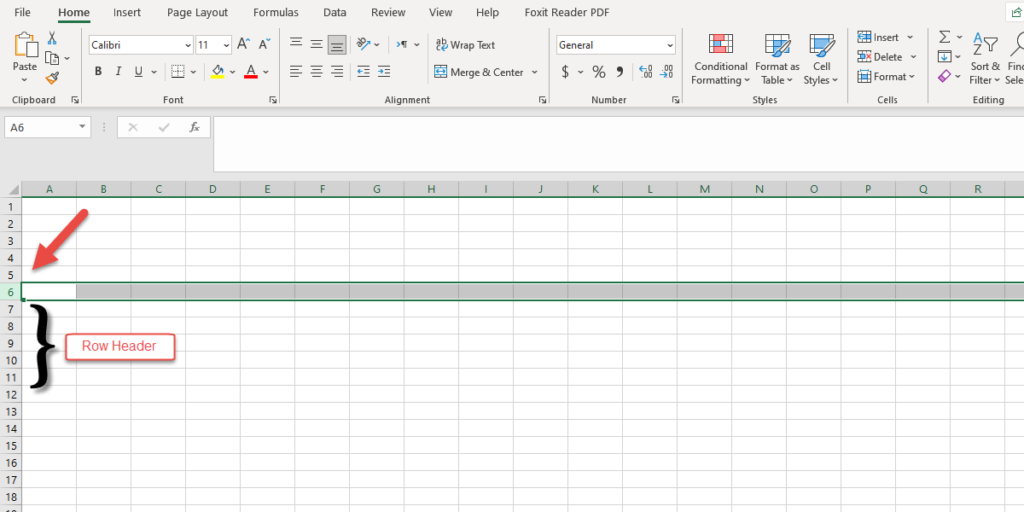
Selection of Rows and Columns
In MS Excel spreadsheet, Rows are labeled numerically (e.g. 1, 2, 3 to 1,048,576). A row is a horizontal series of cells. As you can see in the image, Row 6 has been selected. One way to do this is by clicking on number 6, or any number you want.
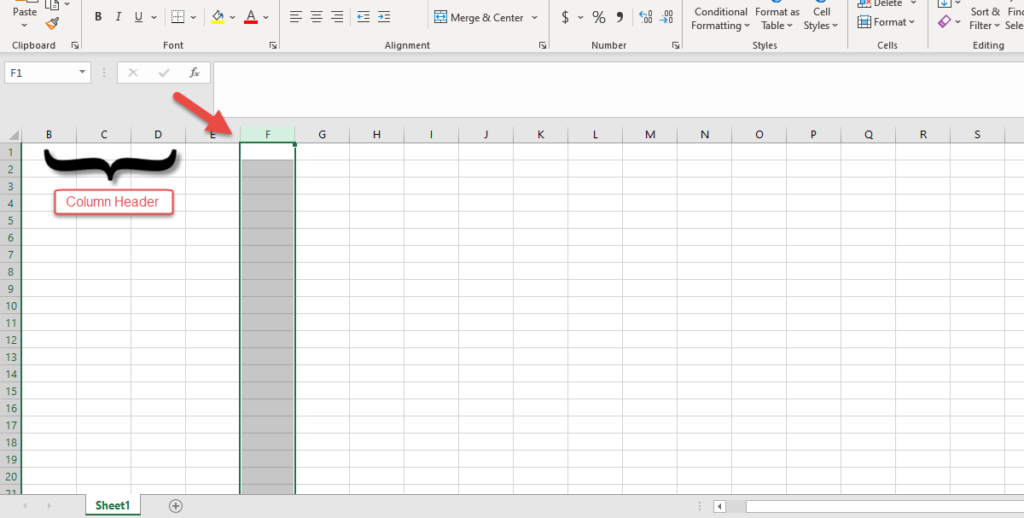
Columns in Excel spreadsheets are labeled with letters of the alphabet (e.g. A, B, and so forth). A column is a series of cells that form a vertical line. As you can see in the image below, column F has been selected. To do this you can click on any of the letters above the column.
Note: Total number of rows and columns on an Excel worksheet is 1,048,576 rows by 16,384 columns in the newer versions. If you’d like to learn more about the specification and limitations of MS Excel, you can visit this page.
Workbook
An Excel workbook contains one or multiple worksheets. You can access the worksheets through the tabs at the bottom of your worksheet, as you can see in the image below. If you want to add a new worksheet, you can click on the ‘+’. The ‘+’ sign is on the right side of the worksheet tabs.
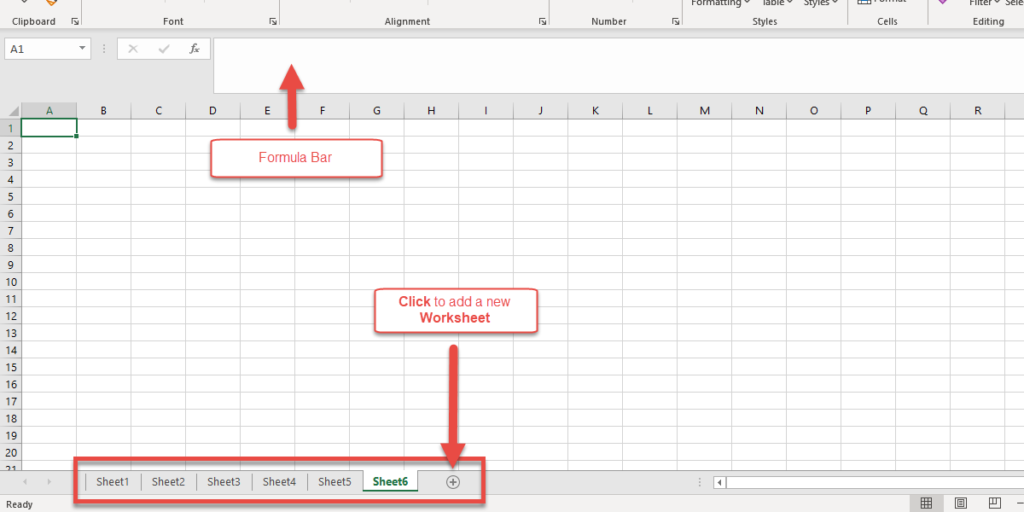
Here, we have added 6 worksheets to the workbook.
Note: Sheet names can be easily changed. To change the worksheet name, all you have to do is to right-click (double click) on the sheet tabs. Then rename the worksheet.
Type of Data You Can Store in a Spreadsheet
We already know that spreadsheets are mainly used to store and manipulate data. But it is important to have an idea about the type of data you can enter into a spreadsheet.
- Numbers: you can enter numeric values such as date, time, scientific numbers, or formatted numbers in each cell. Then you can perform mathematical calculations on them.
- Text: texts can be headings for columns/rows, labels for values, or lists. You can also enter textual information or instructions about the spreadsheet. A cell can contain 32, 767 characters in the newer versions.
- Formulas: Formula is what a spreadsheet is all about. A formula performs calculations when you enter it into a cell. And the formula result appears in the cell. There are different types of formulas ranging from simple mathematical expressions to powerful functions. It is important to note that the ability to use formulas is the most important feature of a spreadsheet.
Example and Purpose of Using a Spreadsheet
What can’t a spreadsheet be used for? Simply everything!
You can, basically, store, sort, and modify different types of data, especially numbers and text in a spreadsheet. The uses of an Excel spreadsheet can be divided into two main categories: daily life and business.
We are going to share with you a few practical examples:
- Calendar: you can create a custom calendar with days in the columns and hours in the rows.
- Lists: you can make any type of list such as to-do lists, shopping lists, or contact lists.
- Travel and Vacation Planning: you can use a spreadsheet to make a packing list, addresses, costs, etc.
- Data Analysis: you can store the required data, calculate statistics, generate charts, conditional formatting, and so on.
- Meeting Agendas: you can create a sheet with a column for time and another column for discussion items.
- Attendance Reporting: you can produce a list with names in a column and another for present/ absent or other information you would like to include in your report.
- Stock Portfolio Tracking: you can create a sheet in which you can include the number of shares, long term vs, short term, stock prices, etc.
Example- Personal Monthly Budget Report in Excel
Now, let’s put what we have discussed into practice; and use an Excel spreadsheet to help us make a very simple personal budget report.
Step1: First of all, create a new worksheet by clicking on the ‘+’ sign. So, we have Sheet2. You can rename it by a double right-click on the Sheet2 tab.
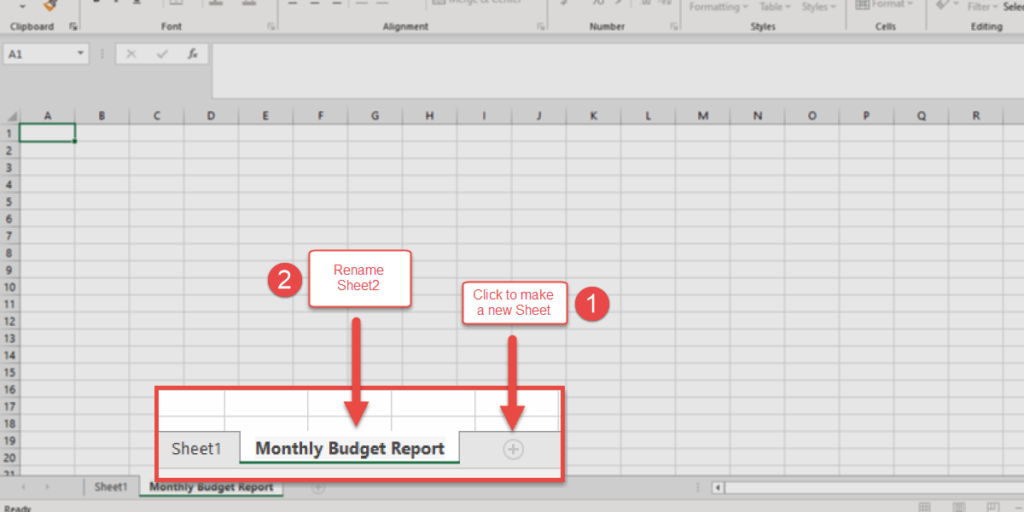
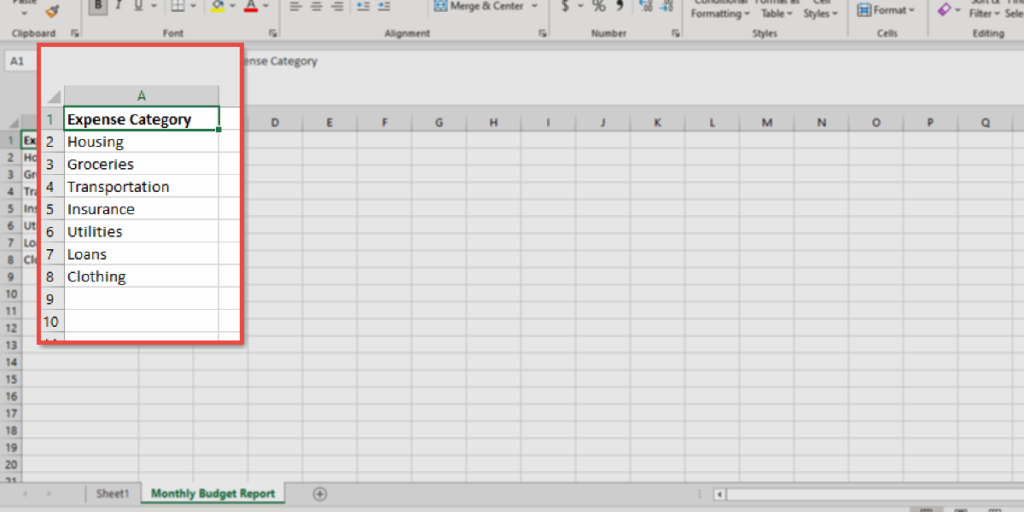
Step2: In the first column, you can type ‘Expense category’. Then give details of the expenses, as you can see below. We have added Housing, groceries, transportation, and so forth.
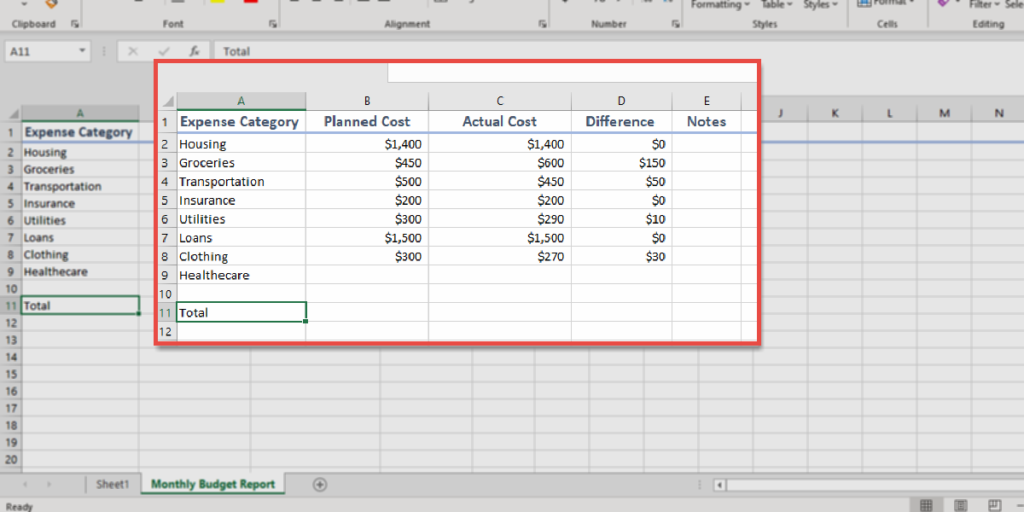
Step3: Add these headings to the next columns ‘Planned Cost’, ‘Actual Cost’, ‘Difference’, and ‘Notes’. Now, fill it with your own data, as you can see we have done in the image.
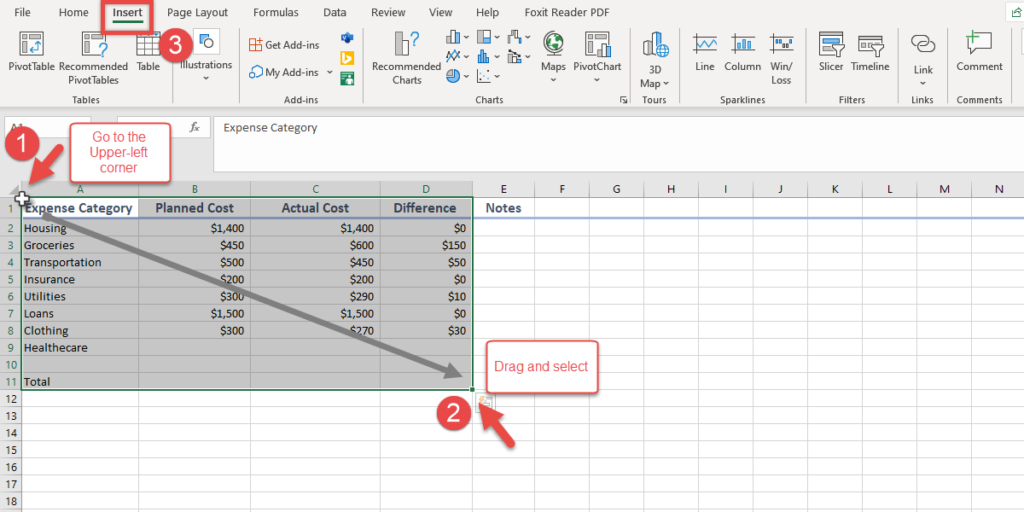
Step4: Now, you can select the table. To do this, go to the upper-left corner of the table (or cell A1), then drag your cursor and select columns A to D. Once you select the Columns, go to Insert in the Excel Menu Bar.
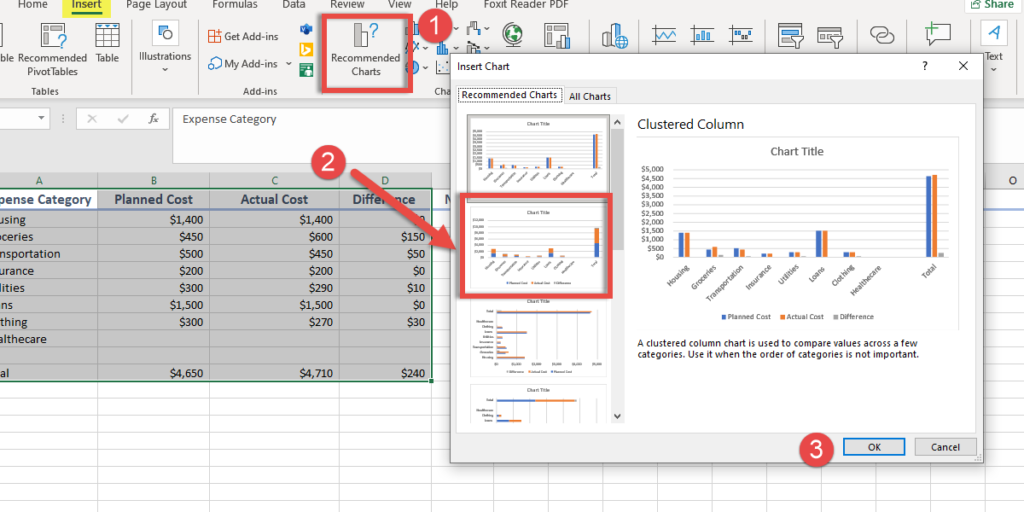
Step5: After selecting the table and clicking on Insert on the Menu Bar. Find the Recommended Charts and click on its option You can choose the first or the second option which are both different types of column charts. The first option is a Clustered Column chart and the second one is a Stacked column chart. We have chosen the second option. Now, click OK.
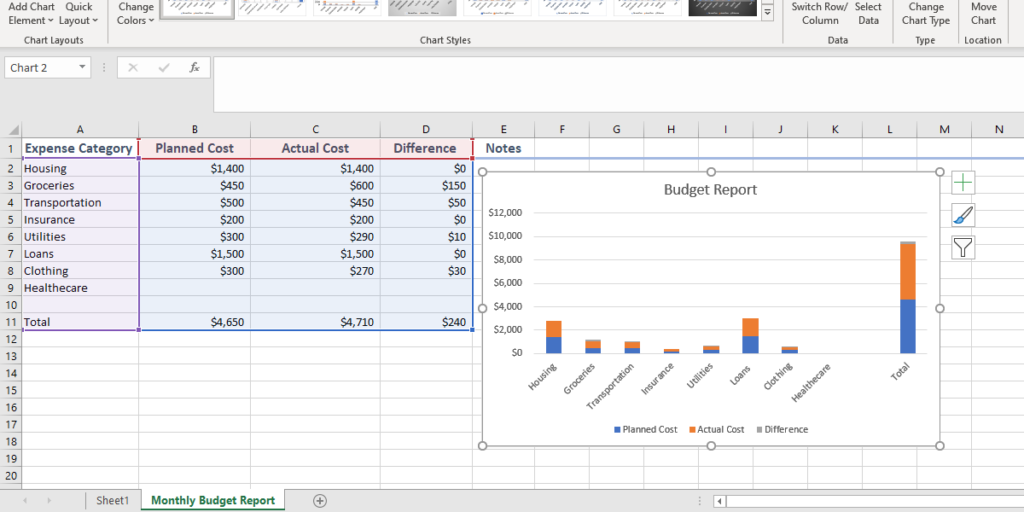
Step6: Now what you have is a Personal Monthly Budget report, including a Stacked Column Chart. As you can see in the image, we have also filled in the total for each column. If you’d like to learn how to add up a column, you can check out the ‘How to Add Numbers, Cells, and Columns in Excel’ blog.
Wrap Up
In this tutorial blog, you have learned what a spreadsheet is, the basics of a spreadsheet, its features, and its purposes. On top of that, we provided a very practical yet simple example to put that knowledge into practice.
We know that a spreadsheet is not only a very flexible and powerful tool for entering, storing, and organizing information, but can also manipulate numerical data using formulas and functions.
It’s not easy to set up a spreadsheet because it can be very time-consuming. There are a wide range of templates available online or come with most software packages. Yet to be able to tap into Excel’s more complex capabilities, it’s important to undergo training and be up to date. Our team of experts are trained professionals who are more than happy to provide solutions for your specific needs. This will surely save you a lot of time and effort.
In this guide, we’ve covered the basics of spreadsheets and their various applications. If you’re unsure whether Google Sheets or Excel is right for you, take a look at our full comparison in Google Sheets vs. Excel: Which is right for you?
FAQ
A spreadsheet is a software or application we use to store, sort, and modify different types of data, and perform mathematical calculations on numerical or statistical data.
Two of the most popular spreadsheet programs are Microsoft Excel and Google Sheets. To create a spreadsheet, first, open MS Excel, then go to the “New” or “Home” tab and select ‘Blank Workbook’. If you want to use Google Sheets, open your Google Drive. Click on the “New” button; from the drop-down menu, select ‘Google Sheets’.
A spreadsheet is made up of rows and columns which form a grid system. The data in a spreadsheet is stored in a cell. You can easily type your data and perform simple to complex mathematical calculations. One of the most distinguishing features of spreadsheets are its formulas and functions. Moreover, you can filter, visualize data and generate reports for different purposes.
Our experts will be glad to help you, If this article didn’t answer your questions. ASK NOW
We believe this content can enhance our services. Yet, it’s awaiting comprehensive review. Your suggestions for improvement are invaluable. Kindly report any issue or suggestion using the “Report an issue” button below. We value your input.


