Waterfall Charts in Excel: A Complete Tutorial
Visualizing data effectively is pivotal for comprehending the cumulative impact of various factors over time. One of the most insightful tools for this purpose is the waterfall chart in Excel. This graphical representation method illuminates the ebb and flow of positive and negative values, a technique frequently employed in financial and project management reports.
Creating a waterfall chart in Excel is a great way to visualize the cumulative effect of positive and negative values on a particular metric over time. Waterfall charts are commonly used in financial and project management reports to show how various factors contribute to a final result.
In the following tutorial, we’ll navigate through a step-by-step process to craft a dynamic waterfall chart in Excel. From data preparation to fine-tuning and customization, each stage is instrumental in creating a comprehensive visualization that elucidates the contribution of different elements to an outcome.
Remember, the steps might slightly vary based on your specific version of Excel or if you’re using an Excel add-in that provides waterfall charts. But generally, these steps should help you create a basic waterfall chart in Excel 2016 or later. Let’s dive into the methodical construction of this illuminating chart.
Boost your productivity by getting a free consultation from Excel experts, and discover tailored solutions to optimize your data management and analysis.
Prepare the Data
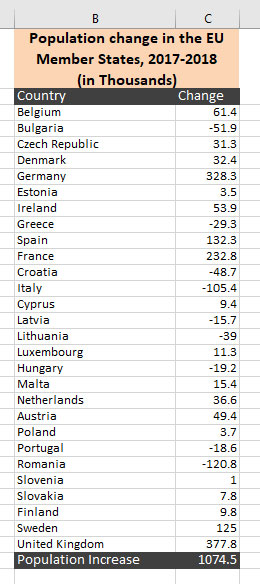
In this blog, we want to use a waterfall chart to show how the increases and decreases in population in the various member states have led to overall population change within the EU. This data is what we call categorical. The sequence doesn’t matter as long as the final population change is shown in the last row.
Bear in mind that if we change the sort order, the chart’s look will change. If you are working with time series data, so transactions over time, then your data must be sequenced from oldest to newest.
Here is a snapshot of our data.
Insert a Waterfall Chart
- Click somewhere in the data range.
- Go to the Insert tab -> Charts and select Waterfall.
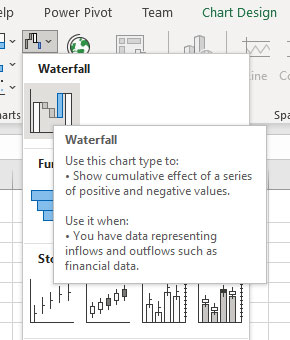
3. The waterfall chart appears on the screen.
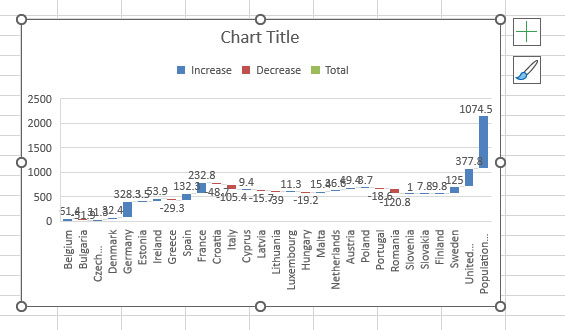
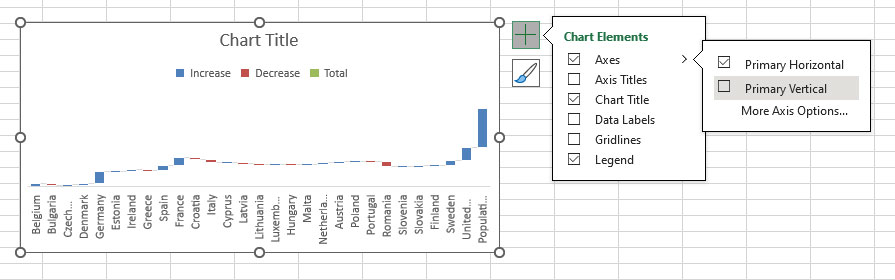
4. There are lots of things we want to change in this chart. We don’t need the data labels, gridlines, and the vertical axis. So click into the chart, go to Chart Elements, and turn the Data Labels, Gridlines, and Vertical Axis off.
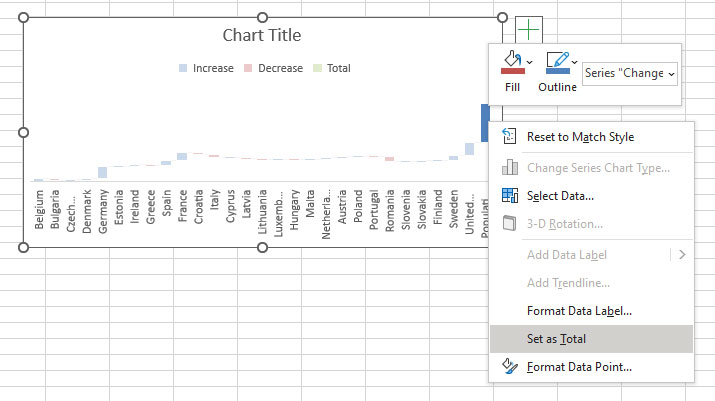
5. Now, if you look a little closely, you’ll notice each increase is shown as a blue step-up, and each decrease in population is shown as a red step-down. There’s, however, one small problem: the final population total is being shown as an increase. To solve this problem, we need to identify the totals manually; this is not done automatically. To do this, click once on the chart to highlight the whole series and then click on the total. Right-click and select Set as Total. If your chart has multiple (sub)totals, you’ll need to apply that for each of the (sub)totals in your chart.
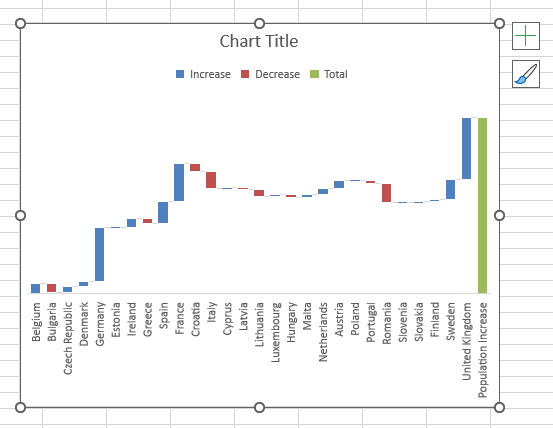
6. Click on the chart title and type a meaningful title for it.
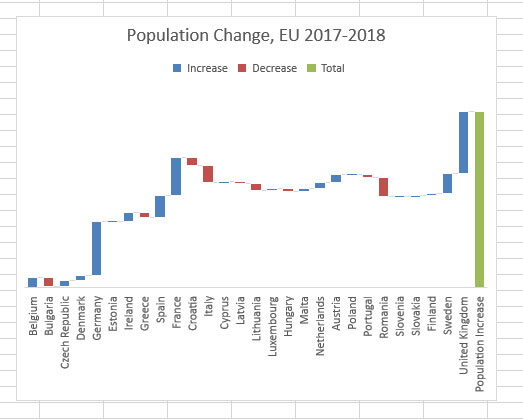
Then there’s our completed waterfall chart.
Enhance your business efficiency with our specialized Macro Development Services, tailored to automate and streamline your operations for maximum productivity.
Add or Remove Connector Lines
In waterfall charts, connector lines connect the end of each column to the beginning of the next column. This helps the observer track the flow of the data in the chart. The chart we have created so far does have connector lines, but we can select to remove them.
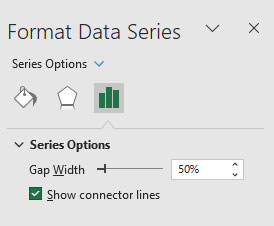
In the waterfall chart, right-click a data series and select Format Data Series.
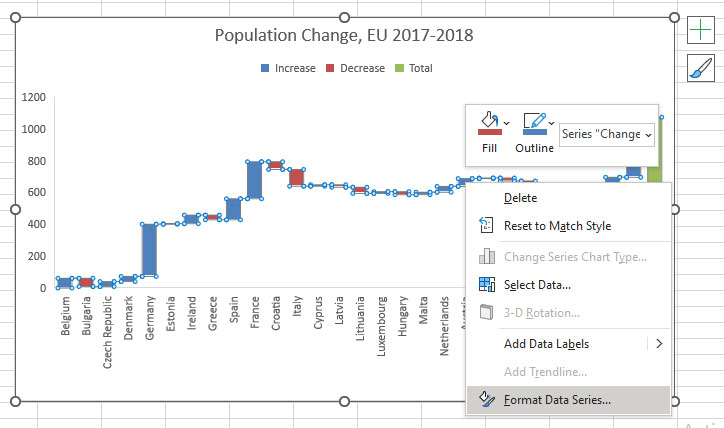
This will open the Format Data Series task pane. In the task pane, you can choose to check or uncheck the Show connector lines.
FAQs
1. What specific scenarios benefit from using a waterfall chart in Excel?
Waterfall charts are exceptionally useful for showcasing changes over time or across different categories in various fields. They are commonly employed in financial statements, project management reports, inventory analysis, and even in depicting contributions to sales performance.
The capability to create waterfall charts might be limited in older versions of Excel. The more recent versions, such as Excel 2016 and beyond, generally have built-in features that facilitate the creation of waterfall charts. For earlier versions, users might need to resort to manual formatting or utilize third-party add-ins. For example, in earlier versions of Excel, you could use a stacked bar chart to create a waterfall chart which has its challenges.
The principles of creating a waterfall chart remain similar even with additional categories. You can adapt the process by assigning each category a role in the data sequence and adjusting the chart’s formatting accordingly.
While Excel is commonly used for creating waterfall charts, other data visualization tools like Tableau, Google Sheets, and various BI (Business Intelligence) platforms offer similar functionalities to create these charts.
You can experiment with different color schemes, add annotations or descriptions within the chart, utilize varying styles for connectors, or even apply animations if you plan to use the chart in a presentation or interactive setting.
Yes, you can automate some steps in creating a waterfall chart by using Excel macros or VBA (Visual Basic for Applications). This can be particularly beneficial if you frequently generate similar charts based on different datasets.
Our experts will be glad to help you, If this article didn’t answer your questions. ASK NOW
We believe this content can enhance our services. Yet, it’s awaiting comprehensive review. Your suggestions for improvement are invaluable. Kindly report any issue or suggestion using the “Report an issue” button below. We value your input.


