Master Inventory Management with Excel
Inventory management is vital to a company’s profitability; it can help you find out what you have and what is needed in your stock. Consequently, it can increase market competitiveness and the brand’s reputation, and improve productivity. As a result, every e-commerce business should find a way to track and manage inventory effectively and effortlessly. There are different methods to do this process; one easy and affordable method is Excel inventory management.
Let’s see how you can create inventory management using an Excel sheet.
How to Create an Excel Inventory Management System?
First, you should create an inventory list. Therefore, follow these steps:
- Create the table of your data with the necessary columns, including product name, price, description, quantity, etc.
- Enter your data, which will be the list of your in-stock products.
Now you have your inventory list. But you need more than just a list because the items in this list will change in the next few days. Therefore, you should be able to automate these changes to avoid further errors. Let’s see what scenarios we have: you sell products, or new products are added to the inventory. These are the most common changes you should consider in an inventory management system. So, to automate these changes, you should write multiple formulas.
8 Useful Functions for Excel Inventory Management
Here is the list of functions you can use for inventory management:
1.SUM/ SUMIF
You can use this function to calculate the total number of an item in the stock or discover your inventory value. Although SUM is very useful, SUMIF will work better for an inventory list because it can support conditions too. For example, if you want to calculate only a specific item, you can use SUMIF in your formula. In this function, you select a range and input the value upon which you want the calculation to be based. The formula will be as follows:
=SUMIF(range, criteria, [sum_range])
Assume you want to count the Blue items in your inventory. So, you should specify a column for colors, then select that column as the range of the function. Then, set the criteria as “Blue.”
In the end, select the column containing the number of items. See the example below:
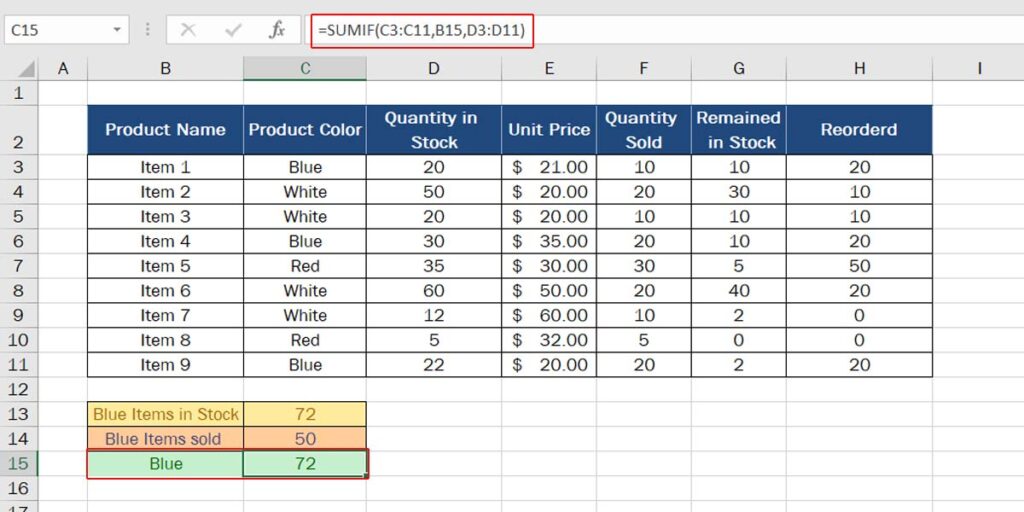
Note that your criteria can be a cell. So every time you want to do this calculation, you don’t have to rewrite the formula. Just change the value in the cell. Like in this example:
2.SUMPRODUCT
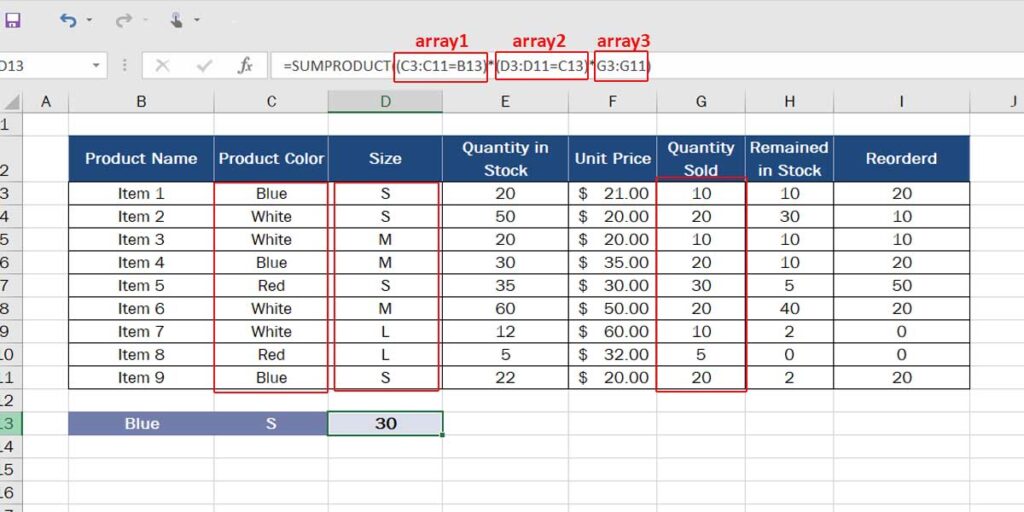
Another function in the SUM group which is very useful for inventory management is SUMPRODUCT. Although this function carries the SUM name, it can operate subtraction and division too. However, the default operation is the sum. SUMPRODUCT can sum the values in one column based on the arrays you define. Assume you want to calculate how many products you have sold that are blue in color and S in size. The formula will be like this:
=SUMPRODUCT(array1, [array2], [array3], …)
3.RANK.EQ/RANK.AVG
Sometimes you need to know the rank of a number in your list. RANK.EQ and RANK.AVG are two functions used for this purpose. But there is a difference between them. RANK.EQ returns the lower rank, i.e. if two numbers in the list are equal, it considers them as one number and returns the lower rank among all other numbers. On the other hand, RANK.AVG returns an average position. The result of these functions will be the same if there is no duplicate number in the list.
Let’s examine these functions in the following example:
As you see, since there are two cells containing the value of 20, the RANK.AVG returns an average rank and RANK.EQ returns the exact rank. If you use the SORT function, the number 20 will be positioned on the 6th and 7th rows.
4. CONCATENATE
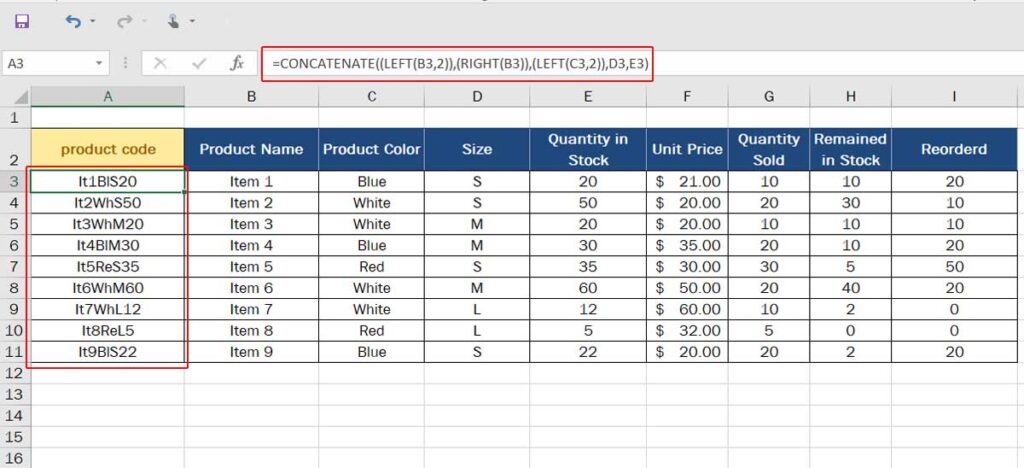
By using the CONCATENATE function in Excel, you can merge various types of data, such as numbers, texts, dates, and other values. Its primary purpose is to combine texts, but it can also be beneficial for generating SKU codes. The formula is written as follows:
= CONCATENATE (text1, [text2], …)
You can combine CONCATENATE with the following function to create a product ID or SKU code.
5. LEFT/RIGHT
As the names of these functions define, they return the character on the left or right side of a text. You can set how many characters you want this function to return. The formula is so simple:
=LEFT (Text, number of characters)
If you don’t specify how many characters you want to extract from the text, it will return only the first character on the left or right.
As mentioned, you can merge this function with CONCATENATE to create a product ID. See the example below:
Assume your product code is a combination of the product name, color, and size. So you can create a code that carries only a few characters of product characteristics. See the result below:
6.COUNTIF
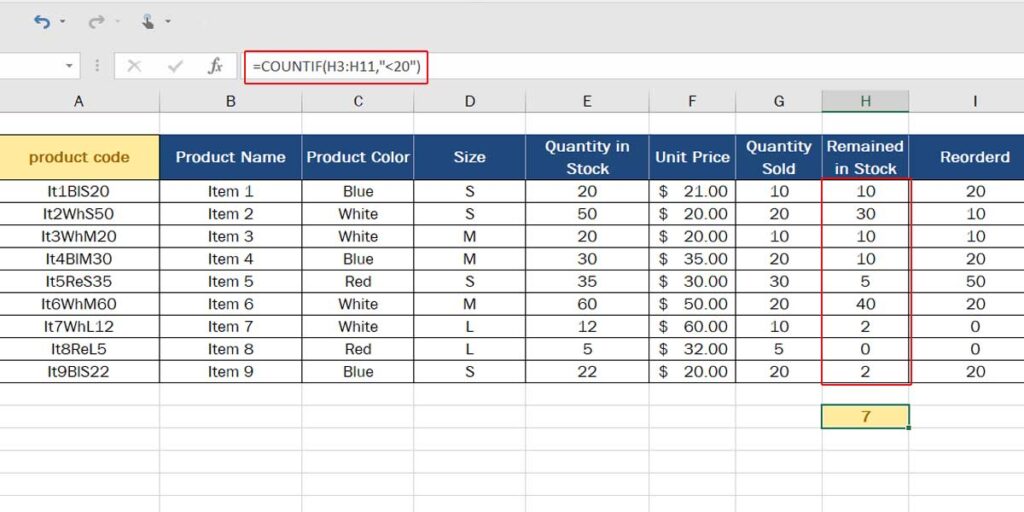
The COUNTIF function in Excel is used to count the number of cells that meet a specified condition. It is one of the most useful statistical functions in Excel. As you can see, in our example, we have 9 items in our inventory. Now we want to know how many items have less than 20 units left in stock. In this case, we can use the COUNTIF function.
=COUNTIF (range, criteria)
In our example, the range is the H column (remained in stock), and the criteria is “<20”. See the result below:
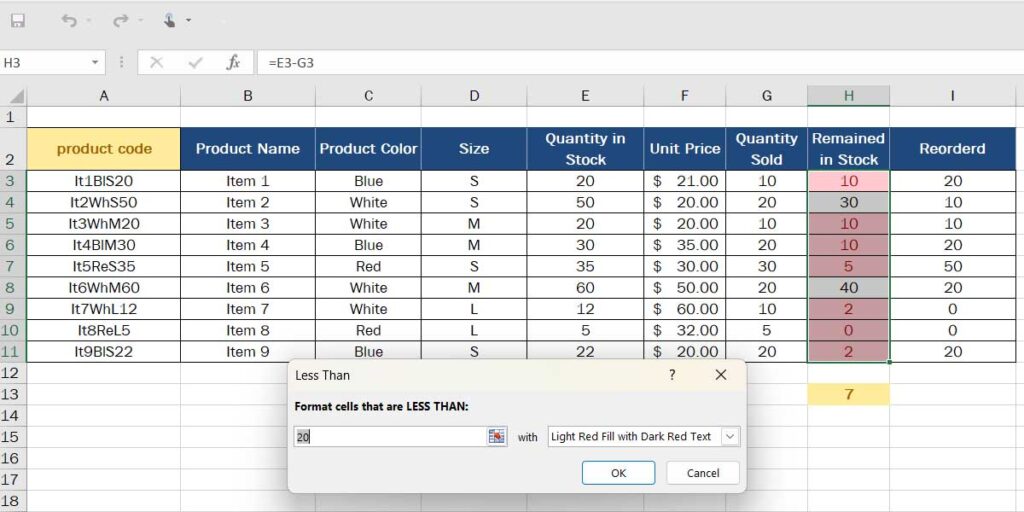
7.Conditional Formatting
First, we should note that Conditional Formatting is not a function. It is one of the options you can find in the Style group on the Home tab. As you can see, this option allows you to change the style of your table based on a condition. For example, in the COUNT example, we can make it much easier to find the items with less than 20 items in stock by highlighting their cells. This will make it more convenient for you to find the items you want to reorder. You can also use this option to create a more concrete report. Let’s look at the previous example with the Conditional Formatting option.
Here we want to highlight the cells that are less than 20.
- First, select the range (H3 to H11).
- Go to the Conditional Formatting option.
- Select Highlight Cells Rules > Less than.
- Enter the number (in our example, it’s 20).
- Select the highlight style (the default is light red).
- Click OK and see the result.
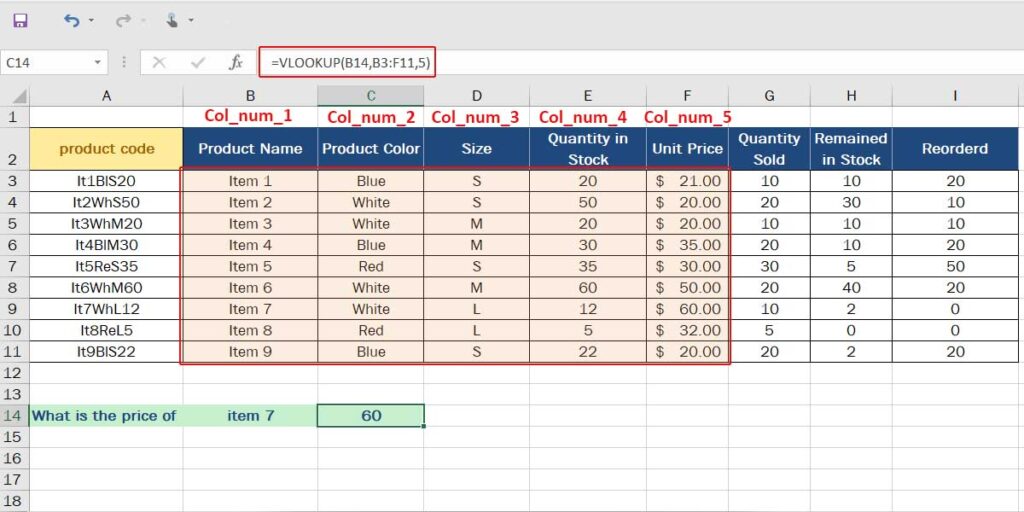
8. VLOOKUP
Working with a large datasheet will be difficult if you don’t know how to work with the VLOOKUP function; one of the most useful functions for data analytics and reporting. Let’s say we want to know the price of a product in our stock. We can use the VLOOKUP function to return this value. The formula is written as follows:
=VLOOKUP (LOOKUP_VALUE,TABLE_ARRAY,COL_UNDEX_NUM, [RANGE_LOOKUP])
In our example, we have specified one cell to LOOKUP_VALUE, so whenever we change the value of this cell, the result will automatically change, which can speed up working with an inventory management Excel sheet. So, the value inside B12 is what VLOOKUP should consider when searching the table. Then we select the range between product name and unit price (B3 to F11). Finally, we select the column for which this function should search.
You should note that the number of columns is specified based on the selected range. In our example, the F column is the 5th column.
As you can see, knowing the simple functions in Excel can help you create a better inventory management system in Excel.
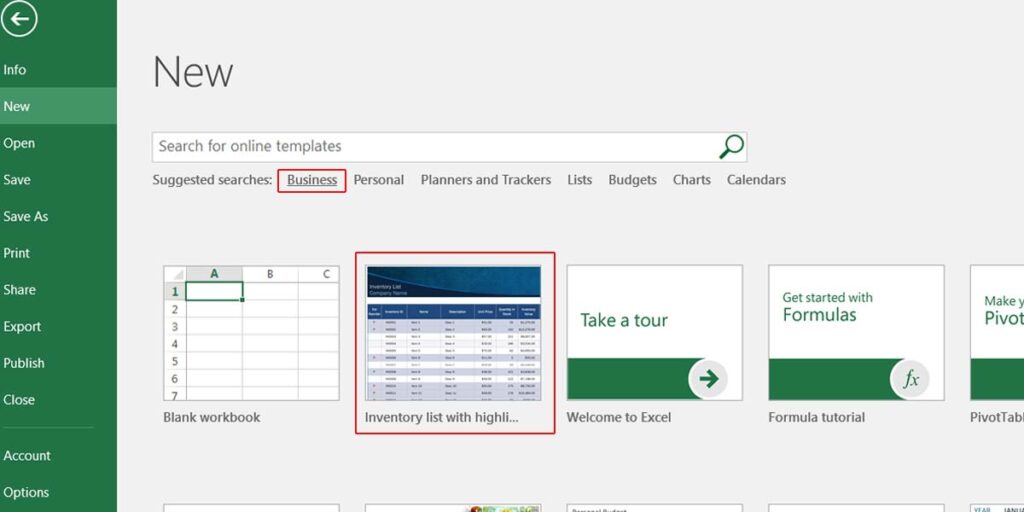
Although it is easy to create such a list, Excel also has a pre-made template for this purpose. Therefore, you can choose this template to start your work.
Empower your business with our Excel Programming and VBA Macro Development Services, tailored to automate tasks and unlock the full potential of your data management capabilities.
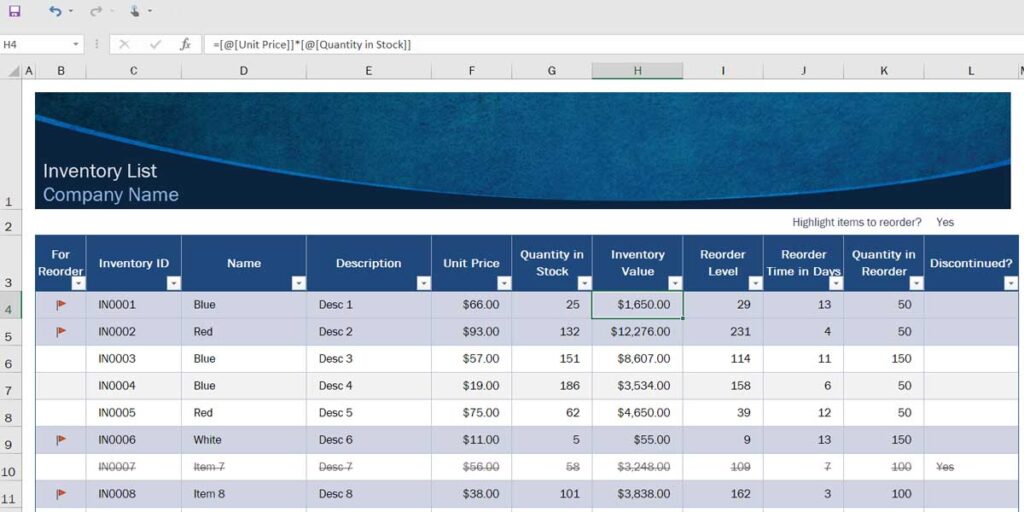
Excel Inventory Management Template
To find an inventory template, you can go to File > New. Then either search for the template or browse the templates under the Business group.
Now you can easily enter your data into this template or add or remove columns. The best thing about this template is that it comes with all the necessary formulas, so you don’t have to write any formulas in the Excel sheet. However, you can still edit this template, change its style and add other columns or formulas according to your preferences.
How to Keep Track of Inventory in Excel?
Creating Excel inventory management is easy, but that’s not enough. You should be able to track your inventory. Here are the tips that can help you keep track of inventory in Excel:
- It’s essential to update your Excel sheet promptly . You should know when new products are entered into the stock or how many have been sold. Therefore, it is recommended to do this update daily.
- Use Excel online so any changes are saved automatically. Therefore, the file is shared with your teammates so that everyone will notice the changes.
- Review your data and always have backup.
- Create a sheet for each month. If your datasheet is not that large and doesn’t require many upgrades, you can make a copy of the latest datasheet and paste it into a new sheet to start the new month. This way, you can compare the reports for each month at the end of the year or every quarter.
- Combine formulas to make it easier to work with Excel for inventory management. Formulas can help you automate more tasks.
Enhance your software capabilities with our customizable Add-In Solutions, seamlessly integrating new features to meet your business needs.
Bottom Line
Excel is a powerful tool for businesses. Whether you want to use Excel for finance, analyzing data, creating automated report, or inventory management, you can always count on Excel as a simple and affordable tool. Excel can help businesses save time and money while improving their overall efficiency. So if you’re looking to streamline your inventory management process, you can use our Excel automation services. Consult with our experts for free.
If you’re a Canadian retailer looking for more tailored Excel solutions, check out our guide on optimizing inventory management with Excel for Canadian retailers.
FAQs
With Excel, businesses can create customized spreadsheets to monitor inventory levels, track sales and purchases, and generate reports on inventory trends and performance. Excel’s built-in formulas and functions can also help businesses calculate reorder points, forecast demands, and identify slow-moving or overstocked items. Furthermore, Excel is a flexible and affordable tool for this purpose.
First, you should create an inventory list, including all information about your products in stock. After that, you can add formulas to automate changes on this list.
Excel has pre-designed templates for different types of work. Excel inventory management template makes it more effortless for users to create a management system on this application.
Inventory management allows businesses to optimize their inventory levels and ensure they have the right products in stock at the right time. Effective inventory management can help businesses improve customer satisfaction by ensuring product availability. Additionally, this process can provide valuable insights into sales trends, product performances, and overall business operations, helping businesses make data-driven decisions and stay competitive in their industry.
Yes, you can use Excel to track inventory. The built-in functions and formulas in this application can help companies manage their inventory levels, track inventory movements, and generate reports on inventory performances. However, it should be updated daily to ensure that nothing is overlooked in the report.
Our experts will be glad to help you, If this article didn’t answer your questions. ASK NOW
We believe this content can enhance our services. Yet, it’s awaiting comprehensive review. Your suggestions for improvement are invaluable. Kindly report any issue or suggestion using the “Report an issue” button below. We value your input.
About the Author: Vida.N
document.getElementById(“review-notice”).remove();
document.getElementsByTagName(“hide-notice”)[0].parentNode.remove();
}


