Using Excel to Enhance Employee Performance Analysis
Unlock the Power of Excel for Employee Performance Analysis in HR Data-driven decision-making has become a cornerstone of effective human resource management. HR teams now embrace data to optimize their workforce and drive organizational success. Data-driven performance analysis allows HR


MS Project vs. Other Tools
Mastering Project Risks: Why MS Project is Your Secret Weapon Project management involves balancing various factors that can impact project outcomes. One of the most crucial elements for ensuring success is effective risk management. You might wonder why risk management
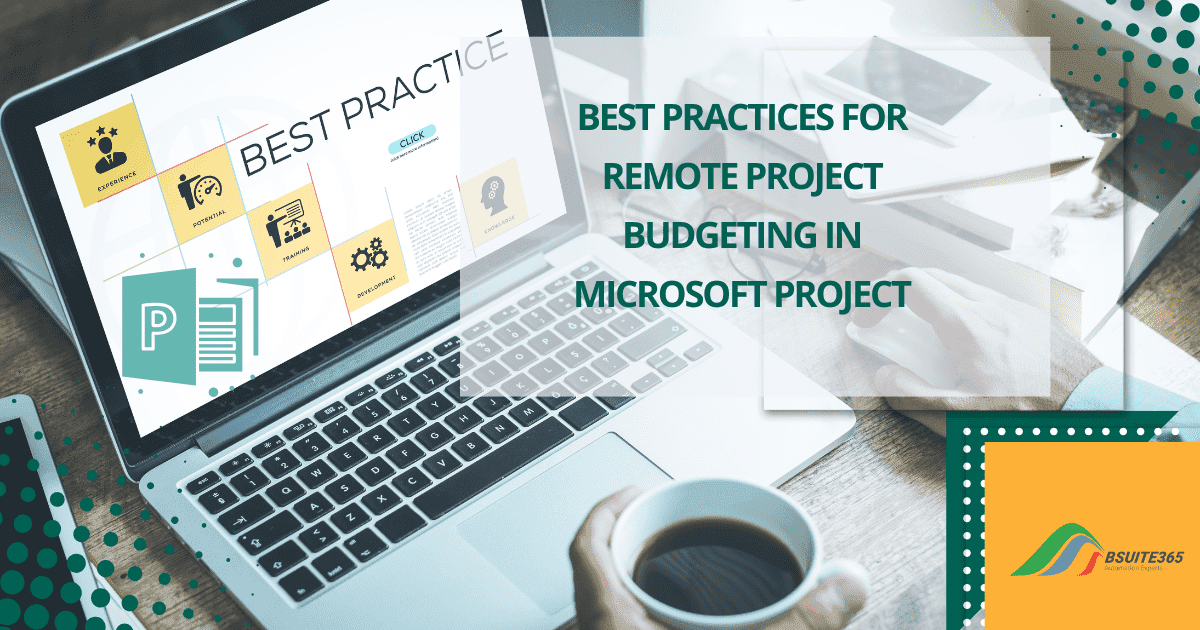
Remote Project Budgeting in MS Project
Budgeting is a crucial aspect of any project, but it can be even more challenging in a remote work environment. With teams scattered across different locations, it's essential to have a robust system in place. Without effective cost control, remote
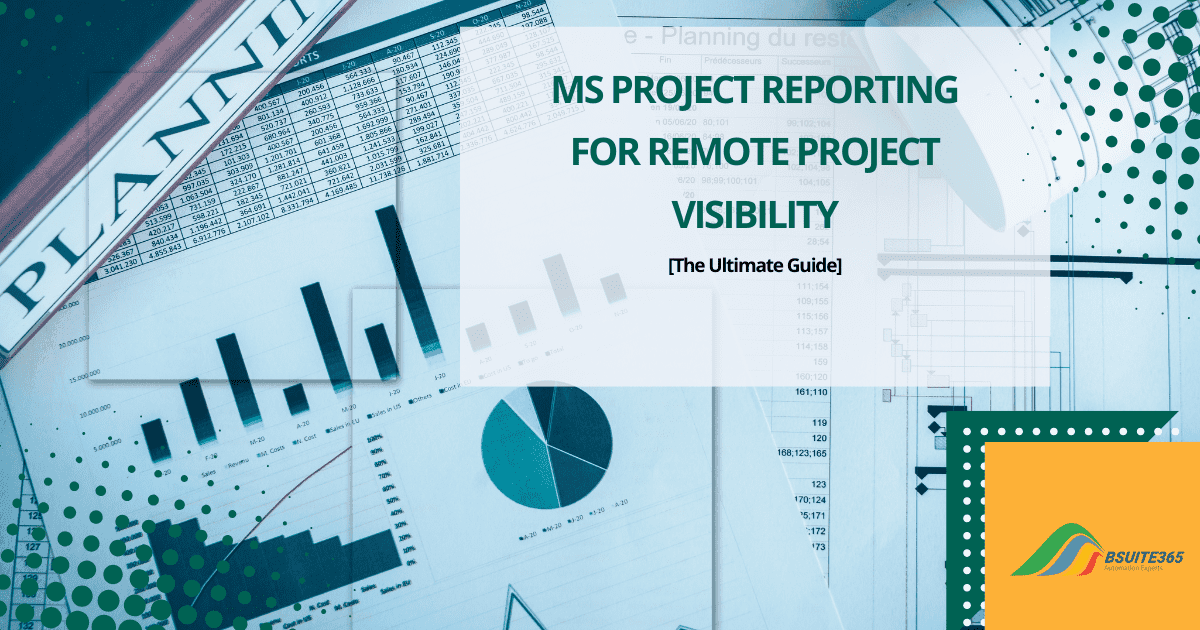
MS Project Reporting for Remote Project Visibility
Remote work is now a central part of the modern workplace. Both employees and employers enjoy increased flexibility but they also face new challenges. One of these challenges is project visibility. Strong visibility in remote projects is crucial. It helps
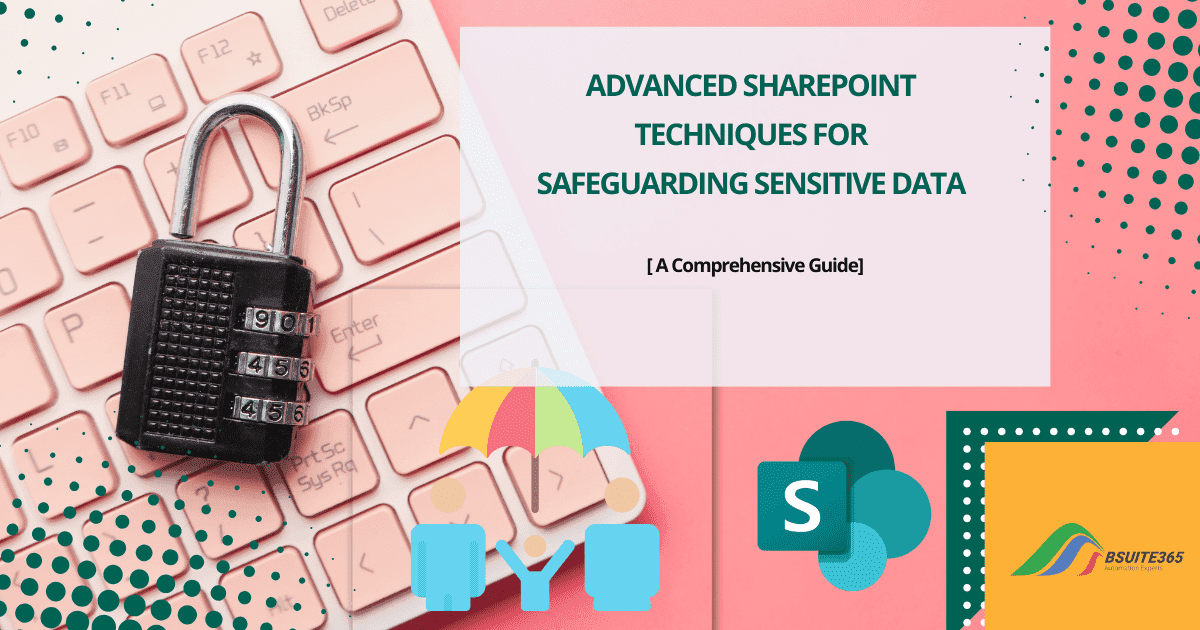
SharePoint Data Protection: Best Practices and Strategies
SharePoint is a collaborative platform for document storage and management. Cloud-based platforms like SharePoint add flexibility to work environments and allow teams to work together from various locations. Additionally, companies share sensitive information on SharePoint, such as financial records, personal

Outlook Email Security Training for Safer Communication
Email has become an indispensable tool for businesses and facilitates communication and collaboration. However, it also serves as an entrance for a wide range of cyber-attacks. Organizations face a variety of email threats, including phishing, spear phishing, malware, and social

Confluence vs SharePoint: Key Differences Explained
As a project manager or an individual who works in remote work environments, you know that the right collaboration tool can make or break a project. Confluence and SharePoint are two popular platforms. But what sets them apart, and which