Mastering Customer Segmentation in Excel
- Preparing Your Data
- Defining Segmentation Criteria
- Data Import and Worksheet Setup
- Creating Segmentation Categories
- Segmenting Your Customer Data
- Visualizing Segmentation with Charts
- Analyzing and Interpreting Segmentation Results
- Personalization and Targeting Strategies
- Testing and Refinement
- Case Studies and Success Stories
- Conclusion
- FAQs
Customer segmentation in Excel allows businesses to categorize their clients into distinct groups based on shared characteristics. By diving into Excel Customer Segmentation Tutorials, companies can leverage their existing customer data to unlock insightful personalization strategies. The magic of segmenting customers in Excel lies in its simplicity and power. Whether you’re looking to deliver marketing messages or develop products for specific audience segments, mastering Excel for marketing segmentation is an indispensable skill. The following sections will outline the steps to achieve advanced Excel segmentation. Stay with us till the bottom line to enhance your marketing effectiveness with our comprehensive guide.
Preparing Your Data
The foundation of successful customer segmentation in Excel begins with the quality and organization of your data. Excel customer segmentation examples consistently show that the more accurate your data is, the more reliable your segmentation results will be.
Let’s define a sample scenario and apply customer segmentation to it step by step: We want to segment customers of “GadgetWorld,” an online retail business. The company has collected customer data over the past year, including demographics, purchase history, and engagement metrics.
Importance of Data Quality and Preparation
Before delving into the specifics of customer segmentation in Excel, it’s crucial to understand why data quality is paramount. High-quality data ensures that your segmentation criteria in Excel are based on accurate, up-to-date, and relevant information, leading to effective personalization strategies. Inaccuracies, missing values, or irrelevant data can skew your analysis, resulting in misguided marketing segmentation.
Cleaning Your Data
The first step in preparing your data for segmentation involves data cleaning in Excel. This means you need to:
- Remove Irrelevant Information: Trim out any data that doesn’t contribute to your segmentation goal. This could include outdated information or irrelevant customer details.
- Handle Missing Data: Identify missing values in your dataset. You can choose to fill these gaps with average values (in the case of numerical data) or categorize them as “Unknown” (for categorical data).
- Correct Errors: Look for and rectify inconsistencies or errors in your data, such as spelling mistakes or incorrect entries.
- Standardize Data Formats: Ensure that all data is in a consistent format. For example, dates should be in a single format across your dataset.
Organizing Your Data
Once your data is clean, organizing it effectively is your next step. This involves:
- Creating Structured Tables: Use Excel’s table feature to manage your data efficiently. Tables offer sorting, filtering, and easy referencing capabilities that are essential for customer data analysis in Excel.
- Segmentation Criteria Columns: Add columns that will serve as the basis for your segmentation, such as age, geographical location, purchasing behavior, etc.
- Data Validation: Use Excel’s data validation feature to ensure that any new data entered into your dataset adheres to the necessary formats and standards.
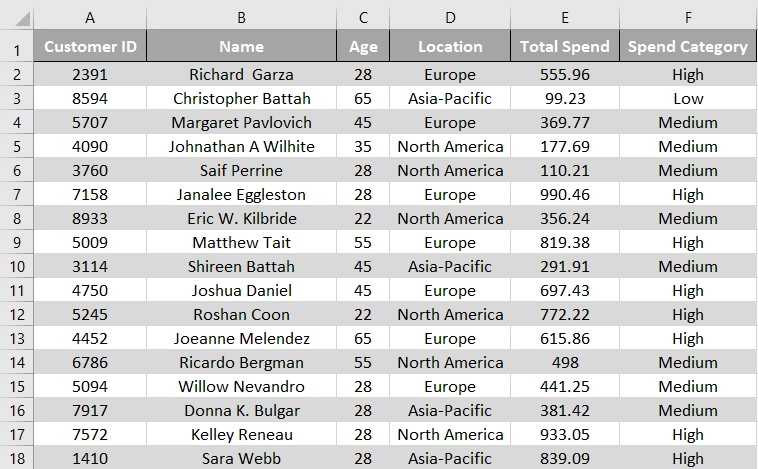
- GadgetWorld’s data has been prepared based on these instructions.
Defining Segmentation Criteria
After preparing your data, the next critical step of customer segmentation in Excel is to define your segmentation criteria. This involves identifying the parameters that will divide your customer base into meaningful segments. Choosing these criteria is pivotal in developing effective personalization strategies in Excel and plays a major role in the success of customer segmentation.
Various Criteria for Segmentation
There are different types of segmentation criteria from which you can choose the proper factors that best suit your business strategies and requirements:
- Demographics: This is one of the most common segmentation criteria, including age, gender, income level, education, and occupation. Demographic segmentation helps in tailoring marketing messages that align with a specific age group or gender, for instance.
- Behavioral: This involves segmenting customers based on their interactions with your business. Criteria here include purchase history, product usage frequency, brand loyalty, and engagement levels.
- Purchasing History: Analyzing past purchases can reveal patterns that assist in segmenting customers based on factors like purchase frequency, average spend, and types of products bought. This is a key aspect of data-driven customer segmentation.
- Geographical Location: Segmenting customers by location can be crucial, especially for businesses whose products or services vary in relevance across different regions.
- Psychographics: This includes lifestyle, values, attitudes, and interests. Psychographic segmentation is often used along with demographic data to gain a deeper understanding of customer motivations.
- Customer Value: This criterion involves segmenting customers based on their value to your business, such as high-spending customers vs. low-spending ones.
Selecting Relevant Criteria for Your Business
Choosing segmentation criteria largely depends on your business model and the objectives of your marketing campaign. To select the most relevant criteria:
- Understand Your Business Goals: Align your segmentation with your overall business and marketing objectives. For instance, if increasing customer loyalty is your goal, focusing on behavioral and customer value criteria might be more beneficial.
- Analyze Your Customer Base: Use Excel for customer data analysis to uncover the most distinct characteristics of your customer base. This will inform you about the criteria that can effectively segregate your customers.
- Consider Data Availability: The criteria you choose should be backed by available data. In Excel customer segmentation examples, you often see businesses leveraging existing data to create meaningful segments.
- Test and Iterate: Don’t hesitate to experiment with different segmentation criteria. Over time, you’ll discover what works best for your specific audience.
- Based on their business goals, GadgetWorld decides to segment their customers using three main criteria:
- Age
- Total Spend
- Location
Data Import and Worksheet Setup
Having established the criteria for your customer segmentation in Excel, the next step involves importing your customer data into Excel and setting up your worksheet appropriately. This stage is pivotal for both Excel customer segmentation tutorial and practice, as it involves laying out the structure that will help you in segmenting your customers effectively.
Importing Customer Data into Excel
Let’s take a look at the steps for importing your customer data into Microsoft Excel:
Gather Your Data Sources
Your customer data might be in various formats (CSV, Excel files, or databases). Ensure you have all the necessary data files ready for import.
Use Excel’s Import Tool
For CSV files, you can simply open them with Excel in a worksheet format. For more complex databases, go to the “Data” tab > “Get Data” > “From Other Sources” to connect to databases like SQL Server. Follow the prompts to import your data.
Check for Consistency
Once imported, skim through your data to ensure everything appears consistent and correctly formatted.
Structuring Your Excel Worksheet for Segmentation
After importing your data into Excel, it’s time to structure your worksheet:
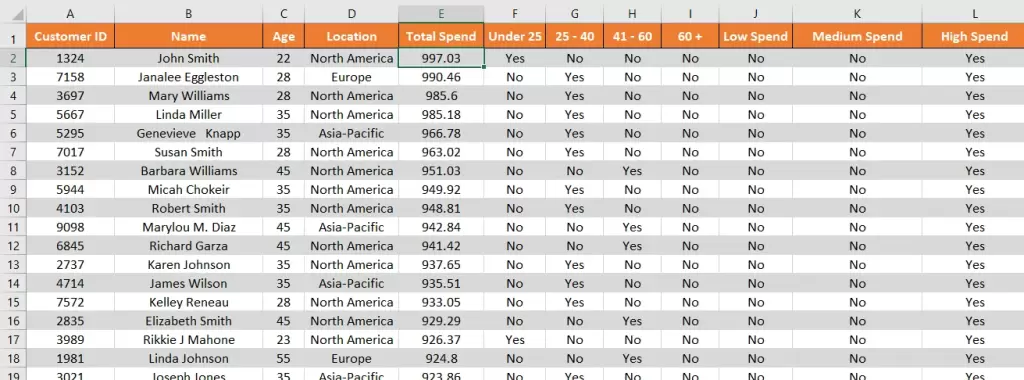
- Set Up Column Headers
Your column headers should reflect the segmentation criteria you’ve chosen. In GadgetWorld examples, common headers include “Customer ID”, “Name”, “Age”, “Location”, “Total Spend”, and “Spend Category”.
- Organize Data in Columns and Rows
- Each row should represent a unique customer.
- Each column should contain data related to a single attribute or criterion.
This will facilitate easier segmentation and analysis later on.
- Create Segmentation Criteria Columns
If you plan to segment based on calculated criteria (like average spend or purchase frequency), you may need to create new columns. For instance, a column for “Average Spend” can be calculated from the “Purchase History” and “Spend Amount” columns.
- Use Conditional Formatting for Easier Visualization
This feature helps with your customer segmentation in Excel to visually distinguish data patterns. For example, you can highlight high-value customers in a different color based on their spending.
- Data Validation for Consistency
Advanced data validation in Excel (internal link) can help you ensure that any new data entered into the worksheet adheres to your required formats. You can access these features through the Data tab > Data Tools > Data Validation.
- Create Segmentation Templates for Excel
For repeated use, save your worksheet structure as a template. This will help in maintaining consistency in your future Excel segmentation endeavors.
- Utilize Tables for Efficient Data Management
Convert your data range into a table. This allows for more efficient sorting, filtering, and analyzing of your data.
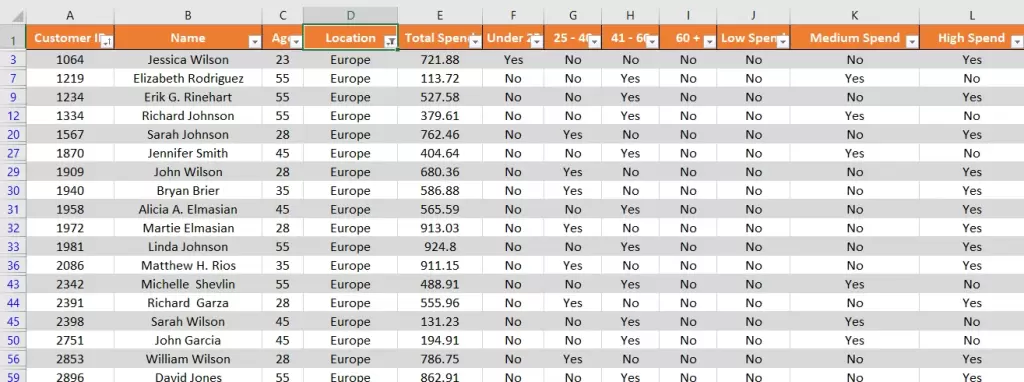
This is what GadgetWorld’s customer data table looks like after applying these instructions.
If you are eager to learn more about Advanced Segmentation Techniques for Precision Targeting (internal link), we recommend you read our blog post on this subject.
Creating Segmentation Categories
With your data imported and worksheet set up, the next crucial phase of customer segmentation in Excel is creating the actual segmentation categories. Excel’s diverse functions and tools make this process both flexible and powerful, enabling you to tailor segmentation to your specific needs. Here, we’ll delve into using these tools to create categories based on your predefined criteria.
Using Excel Functions for Segmentation
Here is how to use Excel features to set segmentation strategies for marketing:
Sorting and Filtering
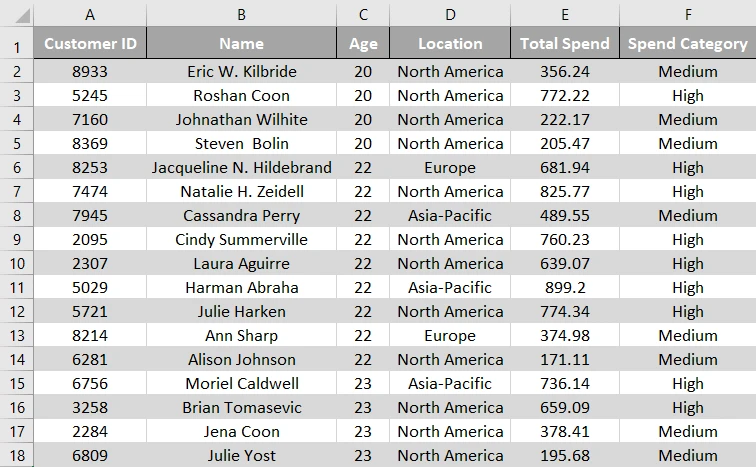
Use the “Sort & Filter” feature in the “Data” tab to organize your data based on specific criteria, like age or location. This can help quickly create categories such as age groups or regional segments.
Here, we have sorted the Gadgetworld data based on age.
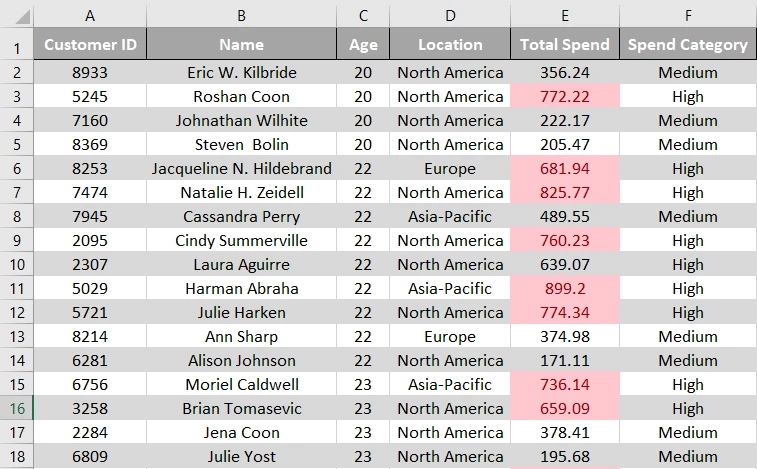
Conditional Formatting for Quick Insights
Conditional formatting can be used to highlight data that meets certain criteria, such as customers with spending above a certain threshold. Go to the “Home” tab > “Conditional Formatting”, and set your rules.
Here, we have highlighted the cells with a total spend above $650.
Using Formulas for Custom Criteria
Formulas like IF, VLOOKUP, or SUMIFS can be used to categorize data based on complex criteria. For example, use IF to create a new column that categorizes customers as “High Value” if their spending exceeds a certain amount.
Step-by-Step Instructions for Criteria-Specific Categories
Now, let’s see how you can create your criteria-specific categories:
Step 1: Define Your Categories
Decide on the categories you want to create based on your segmentation criteria, such as demographic segments, behavioral patterns, or customer value.
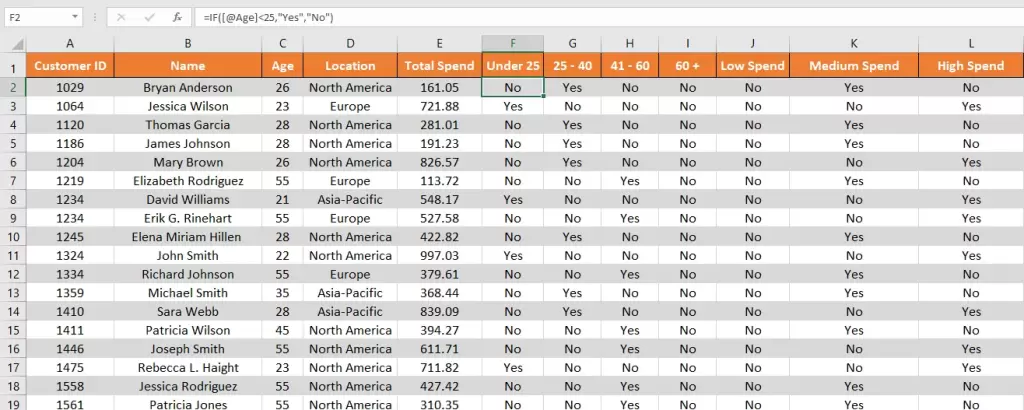
- Using Excel functions, GadgetWorld categorizes customers into different segments:
- Age Groups: Under 25, 25-40, 41-60, Over 60.
- Total Spend: Low (<$100), Medium ($100-$500), High (>$500).
- Location: North America, Europe, Asia-Pacific.
They use formulas to assign each customer to these categories based on their data.
Step 2: Create New Columns for Each Category
Add new columns to your Excel worksheet for each of your categories. For instance, if segmenting by age, you might have columns for ‘Under 25′, ’25-40′, ’41-60′, and ’60+’.
Step 3: Apply Formulas to Categorize Data
In the new category columns, use Excel formulas to assign each customer to a category. For example, in the “Under 25” column, you could use an IF formula like =IF(A2<25, “Yes”, “No”), where A2 is the cell containing the customer’s age.
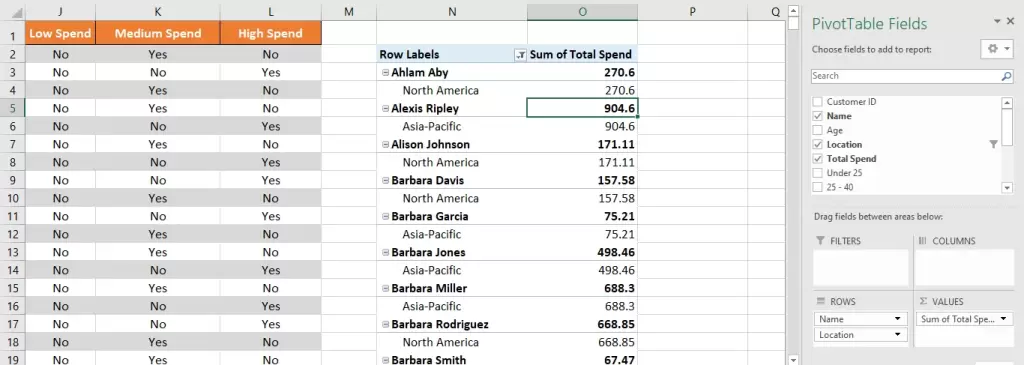
Step 4: Use Pivot Tables for Dynamic Segmentation
Pivot Tables are powerful for customer segmentation in Excel. Select your entire data range and go to Insert > PivotTable. In the PivotTable, drag your category columns to the Rows or Columns section, and relevant data (like customer count or total spend) to the Values section. This will provide a dynamic view of your segments.
Step 5: Refine and Adjust
Continuously refine your categories and formulas based on the insights you gather. For example, you may need to adjust age ranges or spending thresholds for more meaningful segments.
Segmenting Your Customer Data
Now that you have your segmentation categories defined, the next step of customer segmentation in Excel involves actively segmenting your customer data. Excel provides several powerful functions such as filters, sorting, and PivotTables, which are instrumental in this process.
Using Excel Functions for Effective Segmentation
Let’s explore how different Excel functions can be utilized for segmenting customers effectively:
- Filters
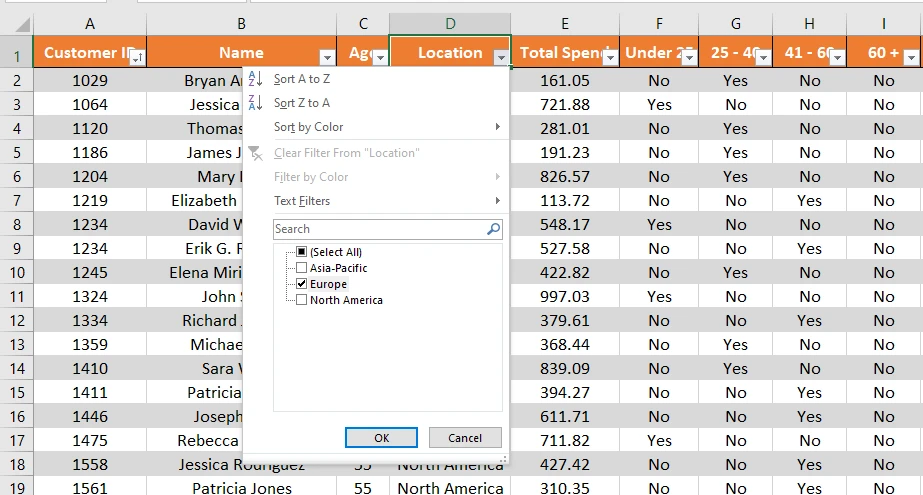
Filters are great for quickly segmenting data based on specific values in a column. For example, to segment customers based on location, simply click the filter dropdown in the location column and select the specific location you want to view.
- Sorting
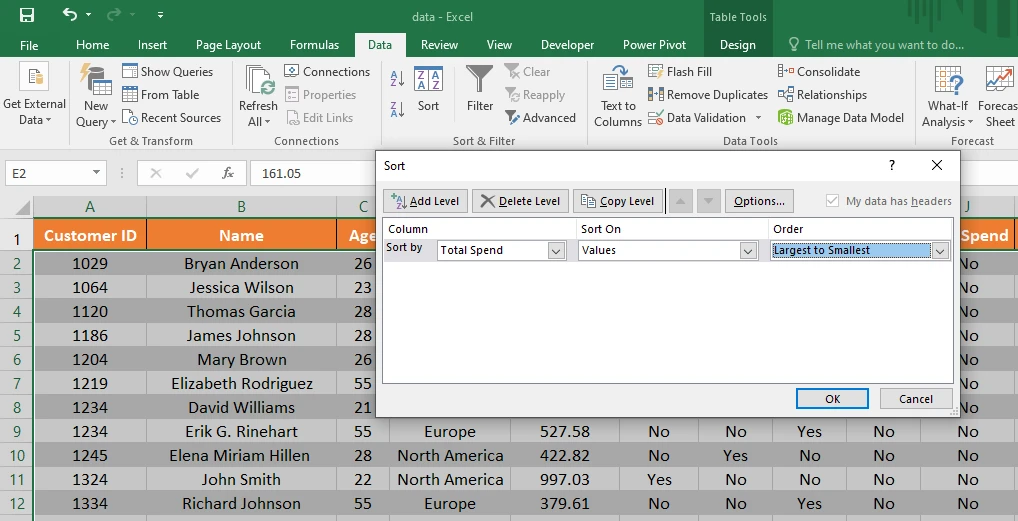
Sorting can help you organize your data in a meaningful order, which is essential for certain types of customer segmentation in Excel. For instance, you can sort customers by total spend amount in descending order to quickly identify your highest-spending customers. To do so, go to the Data tab > Sort & Filter > Sort.
- PivotTables
PivotTables are one of the most powerful tools in Excel for data analysis and segmentation. As mentioned earlier, they allow you to dynamically summarize and analyze large datasets, making it easier to segment data based on multiple criteria.
Visualizing Segmentation with Charts
After segmenting your customer data in Excel, the next impactful step is visualizing these segments using charts and graphs. Visual representations not only make your findings more digestible but also highlight key patterns and insights that might be missed in raw data. Excel offers a range of charting tools that are ideal for this purpose.
Benefits of Visualizing Segmentation Results
Visualization in Excel can bring you a bunch of considerable benefits including:
- Enhanced Understanding: Charts transform complex datasets into understandable visual formats, making it easier to grasp the distribution and characteristics of different segments.
- Better Communication: Visuals are essential for communicating your findings effectively to team members, management, or stakeholders who may not be as familiar with data analysis as you.
- Identifying Trends and Patterns: Graphical representations can reveal trends and relationships between different segments, aiding in strategic decision-making.
- Efficient Reporting: Charts provide a quick and efficient way to report on segmentation results, making regular updates and presentations more manageable.
Creating Visual Representations of Segmented Data
Having visualization benefits in mind, you may ask “How can I visually represent customer segmentation in Excel?” Here is the answer:
- Step 1: Selecting the Right Chart Type
Choose a chart type that best fits the data you want to visualize. For instance, pie charts are great for showing how different segments make up a whole, while bar charts are useful for comparing segments.
- Step 2: Preparing Your Data
Ensure that your data is organized. For example, if you are creating a pie chart for age segments, you should have a summary of each segment’s size.
- Step 3: Creating a Chart
- Highlight the data you want to visualize.
- Go to the “Insert” tab in Excel.
- Choose your desired chart type. For instance, click on “Pie” for a pie chart or “Bar” for a bar chart.
- Excel will automatically create a chart based on your selected data.
- Step 4: Customizing Your Chart
Use the chart tools to customize your chart. You can change colors, add labels, modify the title, and adjust the legend for clarity and better visual appeal. For more detailed data, consider using a PivotChart. It offers dynamic data range updates and more detailed customization options.
- To better understand their segments, GadgetWorld creates visualizations:
- A pie chart to represent the percentage of customers in each age group.
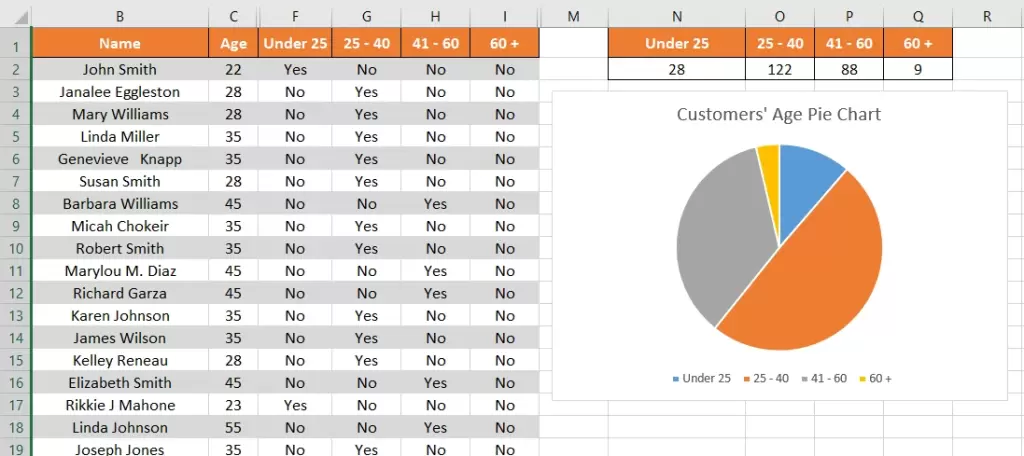
To create this pie chart, you need to create a summary table that counts how many customers fall into each age group. You can do this by using the COUNTIF function. For example, to count the number of customers under 25, use =COUNTIF(F: F, “Yes”)
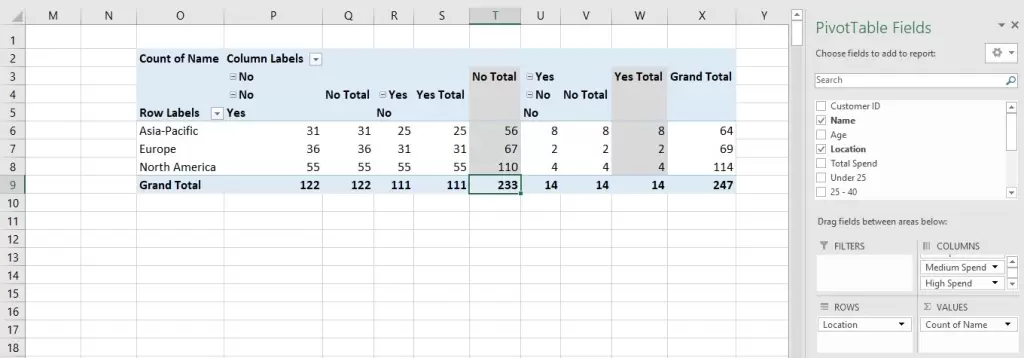
- Bar charts to show the number of customers in each spending category, broken down by location.
You need to summarize the data to count how many customers fall into each spending category within each location. This can be achieved by creating a PivotTable or using COUNTIFS functions.
- To set up a PivotTable:
- Select your data range.
- Go to the Insert tab and click on PivotTable.
- In the PivotTable Field List, drag the “Location” field to the Rows area, the “Spend Category” to the Columns area, and “Customer ID” to the Values area, ensuring it’s set to count rather than sum.
- Once your PivotTable is set up, select it.
- Go to the Insert tab, choose Bar Chart, and select the style you prefer for your data visualization.
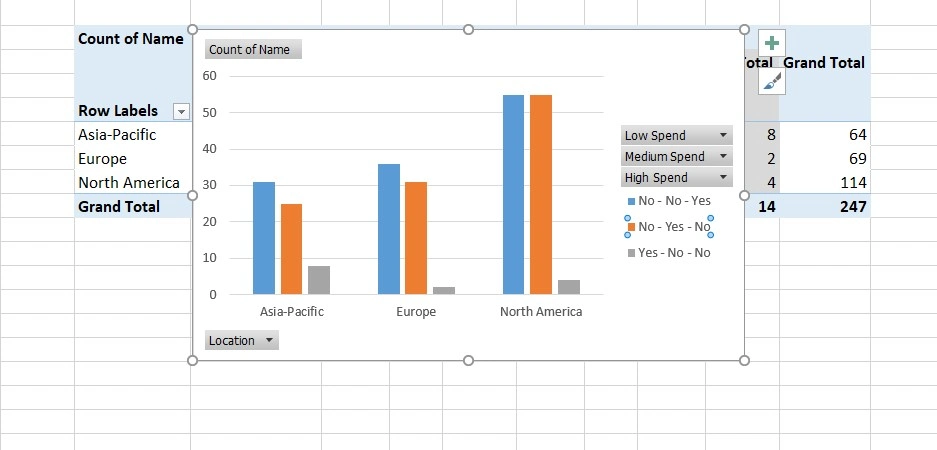
If you add or change data in your original dataset, refresh your PivotTable to update the counts. The bar chart linked to the PivotTable will automatically update to reflect these changes.
Analyzing and Interpreting Segmentation Results
Having segmented your customer data and visualized the results, the most crucial step of customer segmentation in Excel is to analyze the results. This phase transforms raw data into actionable insights, guiding strategic decisions and marketing actions.
Analyzing Segmented Data
Let’s explore the process of analyzing data:
- Examine Each Segment Individually: Start by looking at each segment to understand its unique characteristics. Ask questions like What defines this segment? How does it differ from others? What are its specific needs or behaviors?
- Compare Segments Against Each Other: Compare different segments to identify opportunities or threats. For example, if one segment is significantly more profitable than others, it might require more focused marketing efforts.
- Look for Patterns and Trends: Analyze the data for any patterns, trends, or anomalies. This could include changes over time or unexpected behaviors within certain segments.
- Consider External Factors: Always consider external factors within the larger market and economic environment in your findings. This helps to ensure that your interpretations are grounded in reality.
Interpreting the Results
Once done with analyzing, you need to interpret the results of your data analysis thoroughly. Here are the steps to follow:
- Understand the ‘Why’ Behind the Data: Don’t just focus on the “what”—try to understand why a certain pattern such as a drop in purchases is emerging. This might involve diving deeper into customer feedback, market trends, or competitive analysis.
- Segment Size and Potential: Assess the size and potential of each segment. A small but highly profitable segment might be more valuable than a larger, less engaged one.
- Customer Needs and Preferences: Use your segmentation to infer the needs, preferences, and motivations of different customer groups. This understanding is key to tailoring your products and marketing messages.
Drawing Actionable Insights and Strategic Implications
The insights obtained from customer segmentation in Excel are more than just numbers and categories; they can guide your entire marketing and product development strategy. But how can you draw these insights?
- Identify Opportunities for Personalization: Use your insights to personalize marketing messages, offers, and product recommendations. For instance, you can send promotion messages to your customers based on their previous purchases.
- Inform Product Development: Segmentation results can highlight gaps in the market or unmet customer needs, guiding product development and innovation.
- Optimize Marketing Spend: Allocate your marketing budget more effectively by focusing on the segments that offer the highest return on investment.
- Develop Segment-Specific Strategies: Create strategies that cater to the specific characteristics of each segment. For instance, a strategy for tech-savvy young adults will differ significantly from one targeting retirees.
- Measure and Adjust: Continuously measure the performance of your segment-focused strategies and be ready to adjust based on feedback and changing market conditions.
Personalization and Targeting Strategies
With a thorough understanding of your customer segments from your Excel analysis, the next step is leveraging this knowledge to tailor your marketing strategies effectively. Personalization and targeting are key components of modern marketing, allowing you to reach your audience with more relevance and precision.
Tailoring Marketing Strategies Based on Customer Segments
Let’s see how you can align your marketing strategies with the insights from customer segments.
- Segment-Specific Messaging: Craft your marketing messages to resonate with the specific needs, preferences, and characteristics of each segment. For example, use language and imagery that appeal to the interests of each demographic group.
- Channel Preferences: Identify which marketing channels (social media, email, direct mail, etc.) are most effective for each segment, and focus your efforts there. Younger segments might respond better to social media campaigns, while older segments may prefer email newsletters.
- Customized Offers and Promotions: Design offers and promotions that are likely to appeal to each segment. This could be based on their purchasing history, average spending, or the frequency of purchases.
- Product Recommendations: Use the data from your segments to make personalized product recommendations. Customers are more likely to engage with products that match their previous behavior or preferences.
Crafting Personalized Messages and Offers
Here are the steps toward personalized messages and offers:
- Use Data-Driven Insights: Use the insights from your customer segmentation in Excel to inform the content of your messages. Reference customer preferences and behaviors where appropriate.
- Language and Tone: Adjust the language and tone of your communications to match the profile of each segment. A more formal tone might resonate with professional segments, while a casual, friendly tone might be better for younger audiences.
- Timing is Key: Consider the timing of your messages and offers. For instance, sending promotional emails to working professionals might be more effective during lunch hours or in the evening.
- A/B Testing: Experiment with different versions of your messages and offers to see what works best. A/B testing can provide valuable insights into the preferences of each segment.
- Feedback Loops: Encourage and monitor feedback from your targeted campaigns. Customer responses can provide valuable information for refining your strategies.
- Consistency Across Channels: Ensure that your messaging is consistent across all channels. This helps in building a cohesive brand image that resonates with each segment.
Testing and Refinement
The final phase of effective customer segmentation in Excel involves continuous testing as the dynamic nature of the market necessitates a flexible approach to segmentation strategies.
The Importance of Ongoing Testing and Refinement
Let’s take a look at the importance of ongoing evaluation and adjustment to ensure that your segmentation remains relevant and effective.
- Adapting to Change: Consumer preferences and market conditions can change rapidly. Regular testing and refinement ensure that your segmentation strategies stay aligned with these changes.
- Optimizing Marketing Efforts: Continuous testing allows you to fine-tune your marketing strategies for better performance and higher ROI.
- Data Accuracy and Relevance: As your business grows and gathers more data, your segments may evolve. Regular testing ensures that your segments are always based on the most current and accurate data.
Guidance on Monitoring and Adjusting Segmentation
Customer segmentation in Excel is not a project; it’s an ongoing process that not only needs a robust tracking system but also has to be agile in response to the data. Here are some tips on monitoring segmentation:
- Set Up Key Performance Indicators (KPIs): Establish clear KPIs to measure the success of your segmentation strategies. This could include metrics like conversion rates, customer retention rates, or engagement levels.
- Regularly Review Segment Performance: Schedule periodic reviews of your customer segments. Assess whether the segments are still relevant and effective in achieving your marketing goals.
- Use A/B Testing: Continuously test different aspects of your segmentation, such as criteria, messaging, and channel selection. For example, test two different age segments with the same campaign to see which responds better.
- Gather Customer Feedback: Regularly collect and analyze customer feedback. This can provide insights into how your segments perceive your brand and offerings, and suggest areas for improvement.
- Stay Informed About Market Trends: Keep an eye on industry trends and shifts in consumer behavior. This knowledge can help you anticipate changes in your segments and adapt accordingly.
- Leverage Excel for Analysis: Use Excel to its fullest by regularly updating your data and running new analyses. PivotTables, charts, and formulas should be your tools for ongoing monitoring and analysis.
- Document Changes and Learnings: Keep a record of any changes you make and the results they yield. This documentation will be valuable for understanding what works and what doesn’t over time.
- Be Ready to Pivot: Be prepared to make significant changes to your segmentation strategy if the data supports it. Flexibility is key in responding to new insights or market changes.
Case Studies and Success Stories
To illustrate the practical benefits of customer segmentation in Excel, let’s explore some real-world case studies and success stories. These examples showcase how businesses have leveraged Excel’s powerful segmentation capabilities in their marketing strategies.
Case Study 1: Retail Company Enhances Targeted Marketing
A mid-sized retail company struggled with generalized marketing campaigns that led to low engagement rates.
- Approach: They turned to Excel for a detailed analysis of their customer base, segmenting customers based on purchasing behavior, demographics, and frequency of visits.
- Outcome: By tailoring marketing messages for each segment, the company saw a 25% increase in customer engagement and a 15% uptick in sales, particularly in targeted segments.
Case Study 2: E-Commerce Platform Personalizes Product Recommendations
An e-commerce platform was experiencing low conversion rates and a high cart abandonment rate.
- Approach: Using customer segmentation in Excel, they categorized customers based on past purchase history and browsing behavior.
- Outcome: This enabled them to create personalized product recommendations. The result was a 30% decrease in cart abandonment and a significant improvement in customer satisfaction scores.
Case Study 3: Service Provider Improves Customer Retention
A telecommunications service provider faced challenges with customer churn.
- Approach: They used Excel to segment their customer base into various categories, focusing on usage patterns and customer value.
- Outcome: By identifying at-risk segments and crafting targeted retention strategies, the company reduced its churn rate by 20% within a year.
Conclusion
Customer segmentation in Excel is a powerful tool that, when executed effectively, can dramatically transform your marketing strategies and business outcomes. By segmenting your customer base, you gain a deeper understanding of their needs, preferences, and behaviors, enabling you to engage with them more effectively.
To achieve precise customer segmentation and make informed marketing decisions, businesses often require advanced Excel expertise. If you’re looking to enhance your data analysis capabilities and streamline your segmentation strategies, contact us today to optimize your approach.
FAQs
Start by familiarizing yourself with basic Excel functionalities like sorting, filtering, and creating PivotTables. Excel customer segmentation tutorials can be highly beneficial in this process.
Common criteria include demographics (age, gender, income), purchasing behavior, geographical location, and psychographics (lifestyle, values). The choice depends on your business goals and available data.
PivotTables for summarizing data, VLOOKUP for merging data from different sources, Conditional Formatting for highlighting key data points, and Sorting and Filtering features are essential tools for segmentation.
Start by cleaning your data. Regularly update your data and validate new entries for consistency. Using data validation rules in Excel can help maintain data quality.
Continuously update and refine your segments based on new data and market trends. Use PivotTables for dynamic analysis and employ A/B testing to see which segmentation criteria yield better results.
Yes, there are many free templates available online. Microsoft Office offers Excel templates that can be a good starting point.
Use segmentation to tailor your marketing messages to different customer groups. This personalization can lead to higher engagement and increased customer loyalty.
While Excel doesn’t offer full automation, you can use formulas and Macros to automate some parts of the process such as sorting and categorizing data.
Customer segmentation allows you to personalize your marketing efforts to meet the specific needs of different customer groups, which can improve customer retention rates.
Measure the impact of segmentation on KPIs like customer acquisition costs, conversion rates, customer lifetime value, and retention rates. Regularly reviewing these metrics can help assess the effectiveness of your segmentation strategy.
Our experts will be glad to help you, If this article didn’t answer your questions. ASK NOW
We believe this content can enhance our services. Yet, it’s awaiting comprehensive review. Your suggestions for improvement are invaluable. Kindly report any issue or suggestion using the “Report an issue” button below. We value your input.
About the Author: Sara.Sh
document.getElementById(“review-notice”).remove();
document.getElementsByTagName(“hide-notice”)[0].parentNode.remove();
}


