How to Calculate Standard Deviation in Excel
We all know that Excel is broadly used in statistical calculations. Standard deviation is one of the most useful parameters in statistics. So, we will discuss what it is and how to calculate it.
The Concept of Standard Deviation
The standard deviation is a statistic that indicates the dispersion of the data. In other words, it shows how much the values in a dataset are spread out around the average. Mathematically, it’s the square root of the variance.
A low standard deviation shows that the values in the dataset tend to be close to the mean, while a high standard deviation indicates that the data points are further from the mean.
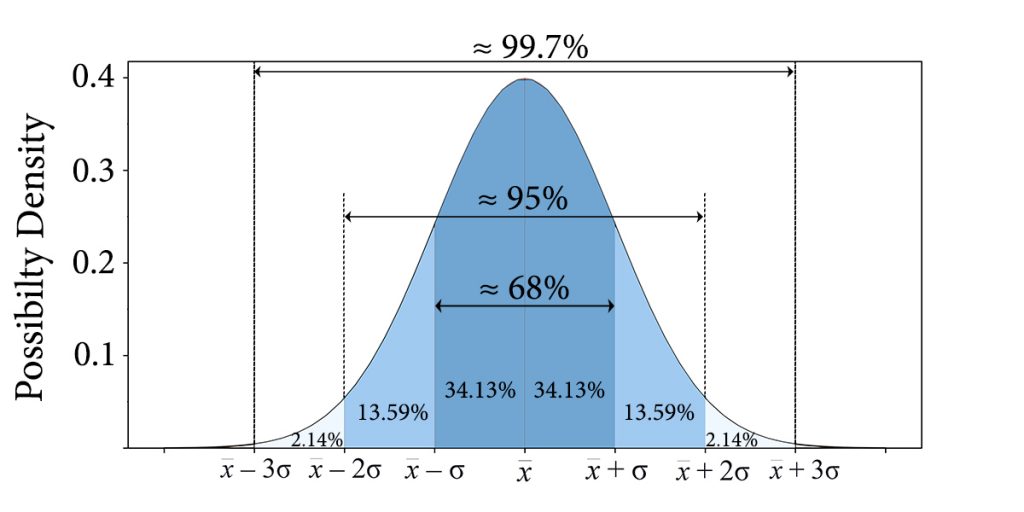
When the standard deviation value of a dataset with the mean of x̅ is a small number (σ), we can say that most of the data points are within the range of x̅ ∓ σ, and when we say most of the data points, we refer to the normal distribution of the sample.
Note: 68% of the values are within one standard deviation away from the mean.
Sample vs. Population Standard Deviation
You might have already heard the phrases “sample” and population” standard deviation. First, let’s see what these phrases are:
Population: Is the entire dataset you want to draw a conclusion about.
Sample: Is a smaller group of the data that you choose to represent the characteristics of the whole population.
In statistics, analysts are more interested in population standard deviation because it contains all the values we are dealing with. Therefore you would calculate the population standard deviation in two cases:
- When you have the entire population
- When you have a sample of a population, and you are only interested in the characteristics of that part of the data.
Now, it’s obvious that you would use the sample standard deviation when you have only a sample of a population, but you want to make a statement about the whole population.
Unlock valuable insights with our Data Visualization and Data Analysis Services, transforming complex data into clear, actionable strategies for informed decision-making.
Functions to Calculate the Population Standard Deviation
The formula to calculate the population standard deviation is as below:
Where xi are individual values in the population, x̅ is the population average, and n is the number of values in the population.
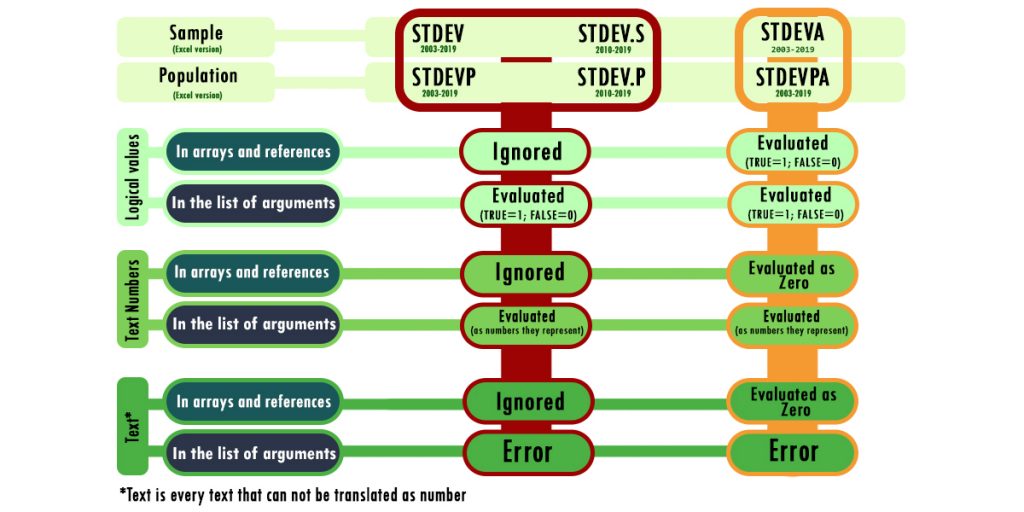
The functions in this category are STDEVP, STDEV.P, and STDEVPA.
- STDEV.P: It is used when the data is numeric. It ignores text values, empty cells, and logical values.
Note: The function counts logical values and text representations of numbers only if you type them directly in the list of arguments.
- STDEVPA: You can use it when you want to include text, logical values, or text representations of the values in the calculations.
FALSE logical value and text values within arrays or reference arguments, including empty strings (“”), text representations of numbers, and any other text, are counted as “0.” TRUE is counted as “1.”
Note: If you type text representation of the numbers directly in the function, it will count them as the numbers themselves.
- STDEVP: It is the old version of the STDEV.P function.
Functions to Calculate the Sample Standard Deviation
The formula to calculate the population standard deviation is as below:
Where xi are individual values in the sample, x̅ is the sample average, and n is the number of values in the population.
The functions in this category are STDEV, STDEV.S, and STDEVA. The way to use these functions is exactly like the STDEVP, STDEV.P, and STDEVPA functions, respectively, but for the sample standard deviation.
Here’s how any of these functions treat different types of inputs:
Example 1- Calculating SD of a Population
Assume that you have the following dataset:
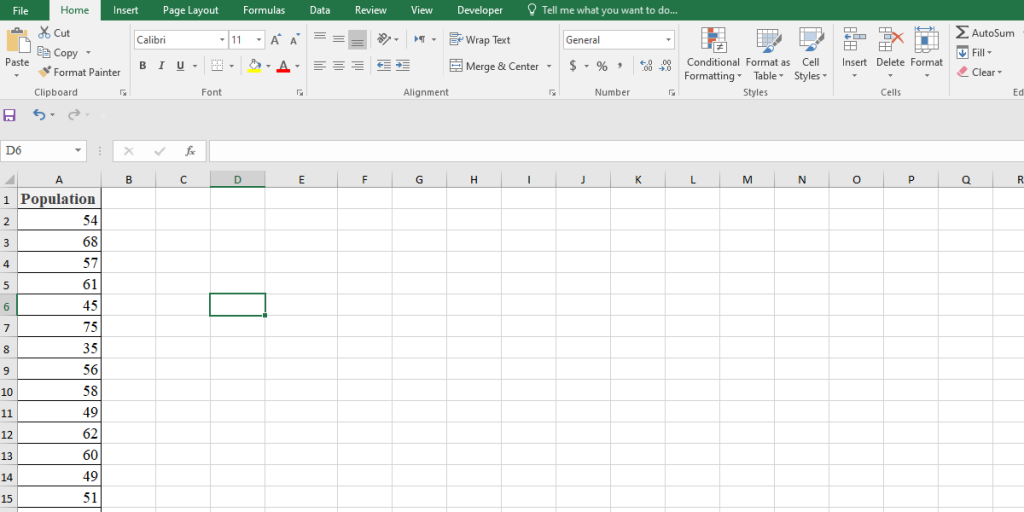
We are going to calculate the SD using both mathematical formulas and Excel functions.
Transform your financial analysis with our comprehensive Excel Financial Modeling Services, providing accurate and insightful models to drive informed decision-making.
Calculating the SD of a Population Using Mathematical Formula
If you want to calculate the SD using the mathematical formula, follow the steps below:
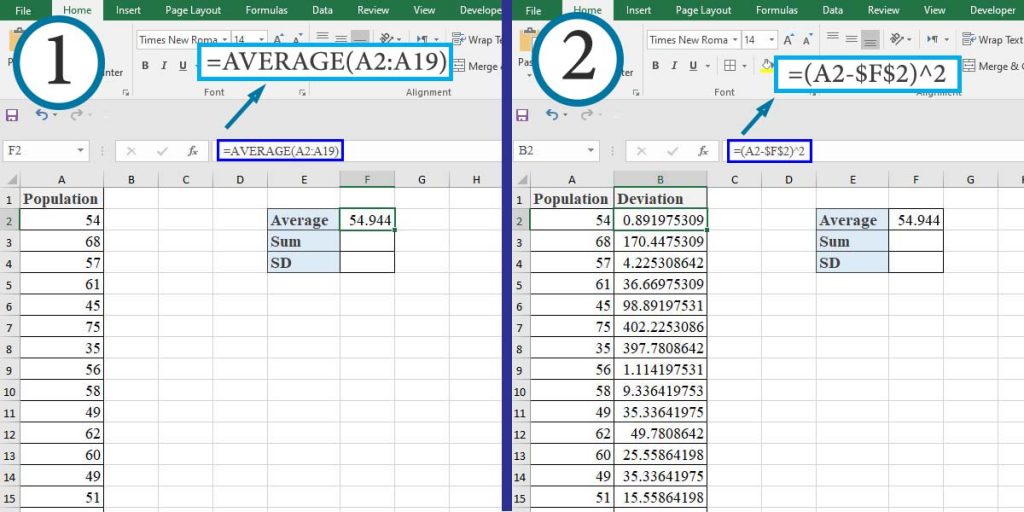
- Calculate the average in the cell F2.
- Type “=(A2-$F$2)^2” in cell B2 and press Enter. Then double-click on the bottom right of the cell.

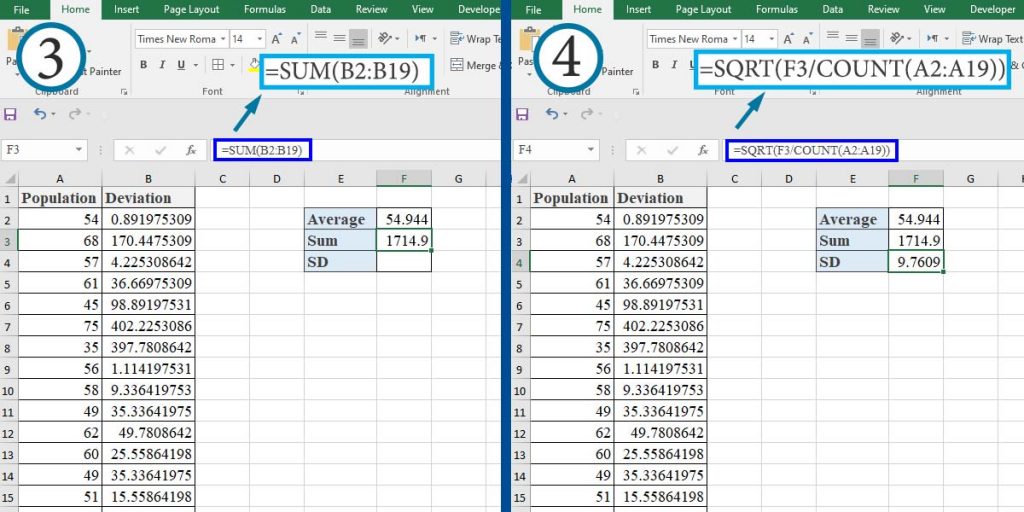
- Type “=SUM(B2:B19)” in cell F3 and press Enter.
- Type “=SQRT(F3/COUNT(A2:A19))” in cell F4 and press Enter.
Calculating the SD Using the STDEV.P Function
Instead of doing all those steps, you can calculate the standard deviation using the STDEV.P function.
The syntax of the function is as below:
=STDEV.P(number1, [number2], ...)
Number1: The first number in the population (required)
Number2, …: the rest of the numbers in the population (optional)
Note: You can also use a single array or reference an array instead of arguments separated by commas.
Now, to calculate the SD of the population, type “=STDEV.P(A2:A19)” in cell F5.
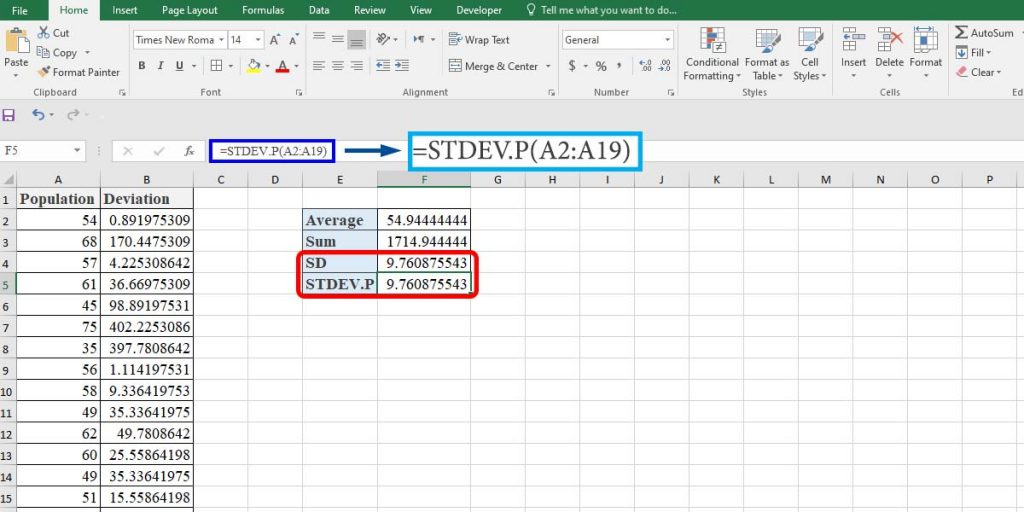
As you can see, both methods give the same result.
Example 2- Calculating SD of a Sample
Suppose that the above dataset is a sample for a larger population. Again, we’ll calculate the SD via both mathematical formula and the STDEV.S function.
Calculating the SD of the Sample Using Mathematical Formula
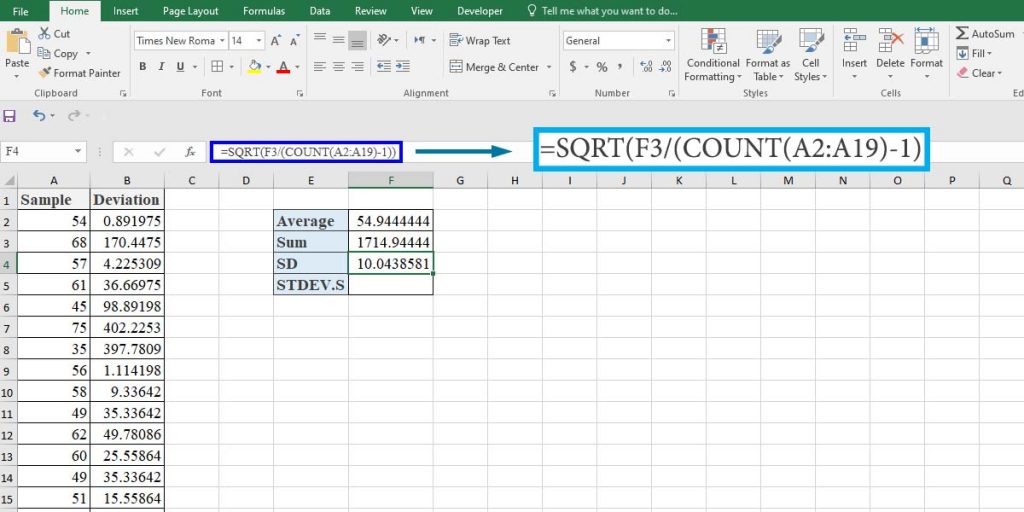
All of the steps in this method are the same as the previous one, except that in step 4, instead of that formula, type “=SQRT(F3/(COUNT(A2:A19)-1))” in the cell F4.
Calculating the SD of a Sample Using the STDEV.S Function
The syntax of the function is exactly the same as the STDEV.P function.
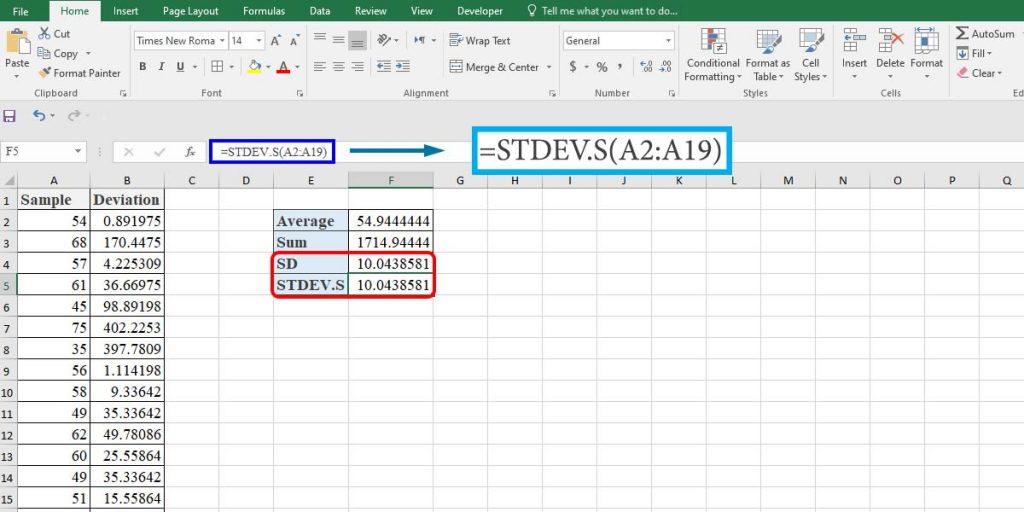
To calculate the SD of the sample, type “=STDEV.S(A2:A19)” in cell F5.
Wrap up
The key to deciding which function you should use to calculate is knowing whether you have the entire population or a sample of the population. Knowing this, you can choose the proper function and carry out the calculation.
We covered almost everything you need to know about standard deviation in Excel.
You can connect with us, make inquiries, and get further Excel Support services.
Reduce cost, accelerate tasks, and improve quality with Excel Automation Services.
Our experts will be glad to help you, If this article didn’t answer your questions. ASK NOW
We believe this content can enhance our services. Yet, it’s awaiting comprehensive review. Your suggestions for improvement are invaluable. Kindly report any issue or suggestion using the “Report an issue” button below. We value your input.


