Power BI Analysis in Excel
What is Power BI Analysis in Excel?
Those who work with data know that a crucial step in data analysis is how you present the data. Excel is a powerful tool for data organization and mathematical calculations; however, we sometimes need special tools to convert data into business information for strategic decision-making. To convert the data into practical information for strategic decisions and business, we need software that contains more specific tools.
If you’re working with databases, you might also be interested in connecting Excel to Microsoft SQL Server, which allows you to pull data directly into Excel for deeper analysis.
Here, we’re going to share some details about BI and explain how it’s used step by step.
What is BI?
Business Intelligence is a process that uses technology to analyze data.
Business intelligence includes technology and procedures used by businesses to analyze data and manage information.
It helps enterprises understand which factors contribute to the success or failure of a project. For instance, businesses want to find out which factors contribute to profitability and which ones reduce profitability.
What is Power BI?
A technical process to analyze a data set.
Power BI is a tool developed by Microsoft. It analyzes existing data sets, summarizes reports, produces charts, and includes dashboards and maps to provide users with the business status. Ultimately, managers, business owners, and key decision-makers use Power BI as a solution to drive business results with actionable insights.
How to Access Power BI?
There are three ways we can access this tool:
- Power BI Desktop
- Power BI Service
- Phones and Tablets (Android and IOS devices)
How to Download Power BI Desktop?
To download the Power BI desktop version, you can follow these steps:
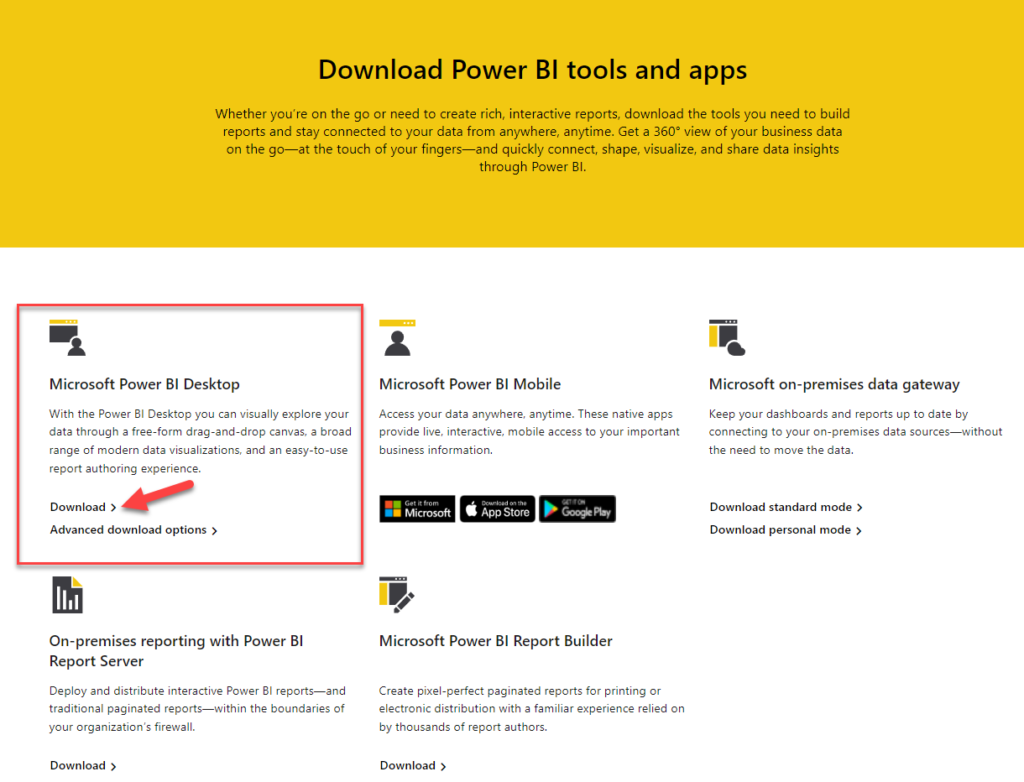
- Go to the Power BI Microsoft web page and click on this link.
Download Power BI tools and apps - From the Microsoft Power BI desktop section, click on Download.

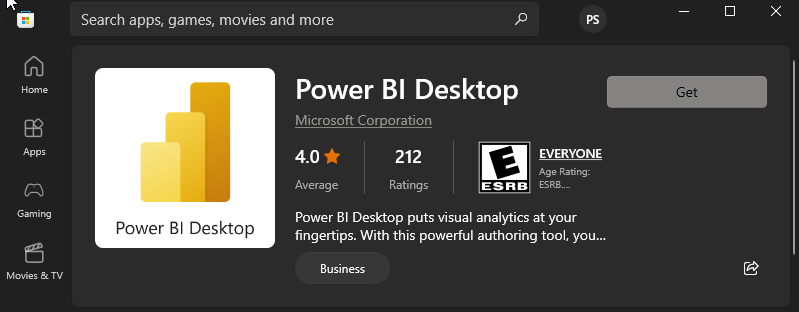
- Get the app from the Microsoft Store.
Power BI Features
The strongest feature of Power BI is enabling users to combine data from multiple sources. That’s why we aim to learn to use an Excel file as a source in Power BI. But before that, let’s check out the other important features of Power BI.
- Interactive dashboard
- Adjustable dashboard
- Collaborate and share
- Efficient charts
- Database filtering
- Data analysis dimension in DAX
- Automatically launch Office 365
- Ad Hoc Reporting
- Ad Hoc Analysis
- Online Analytical Processing (OLAP)
Excel and Power BI Differences
Here we have referred to some of the differences between Excel and Power BI:
- Power BI is mainly used for reporting through data visualization and dashboard sharing, while Excel is primarily used for in-depth analysis and calculations.
- Power BI needs an IT expert, but almost everyone can work with Excel.
- Power BI can manage huge amounts of data, yet managing a large database is not easy in Excel.
- Power BI is more Interactive compared to Excel.
- Power BI is faster and more efficient than Excel for creating dashboards.
What Should I Know about Excel to Use Power BI?
Firstly, Power BI has a built-in AI and is tightly integrated with Excel.
To use Power BI, users should at least have a general understanding of Excel.
For example:
- How to Enter, Edit, and Format Text and Numbers in Excel?
- How to Find and Replace in Excel?
- How to Insert and Format Charts in Excel?
- How to Sort and Filter Charts in Excel?
- How to Format a Table in Excel?
- What is Conditional Formatting in Excel, and How to Use it?
Power Query in Excel
In addition, you should know how extensions work in Excel to help you correct and administer your data. Power Query is a powerful business intelligence tool that is used to import data from an external source. It also shapes, sorts, transforms, and automates your data processes. Power Query is considered an ETL, but what’s ETL?
What is ETL?
The Power Query tool is an ETL tool.
ETL= Extract / Transform / Load
Extract
In the first stage, we need a data set. Power Query is the most helpful tool that can extract various data sets from different sources. It may seem confusing to name the first step “Extract.” It may help you to remember that we want to extract the raw data from some sources, transform it into the data we need, and load it to output data into what is called a container.
Which data sources can Power Query support?
This is a list of data sources Power Query is able to support:
- BI Connector
- Analysis Services
- Text/CSV
- Blank Query
- OData Feed
- SQL Database
- MySQL Database
- PostgreSQL Database
- Blank Query
- Jethro (beta)
- Kyligence
- Azure Cloud Platform
- Web Platform
- Google Analytics
- Google BigQuery
- Flat Files
- Common Data Services (Dataverse, Dataflows, etc.)
- Linkar PICK Style / MultiValue Databases (beta)
- Access Database
- AtScale Cubes
- IBM Db2 Database
- IBM Informix Database (beta)
- IBM Netezza
- Exasol
- Indexima
- InterSystem IRIS (beta)
- Oracle Database
- Sybase Database
- Teradata Database
- Amazon Redshift
- Amazon Athena
- Impala
- Vertica
- MariaDB
- MarkLogic
- SAP HANA Database
- SAP Business Warehouse Massage Server
- SAP Business Warehouse Application Server
- TIBCO® Data Virtualization
- Denodo
- Dremio Software
- Dermio Cloud (beta)
- Essbase
How to Connect to a Data Source by Power Query?
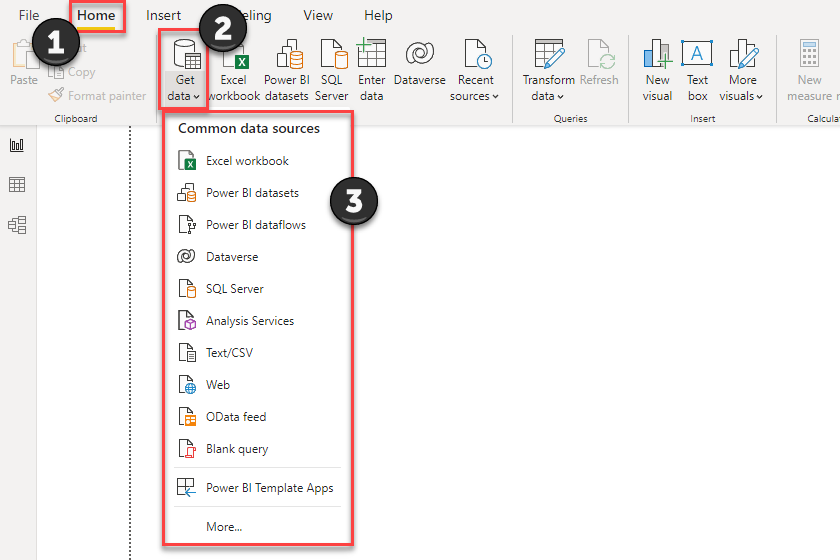
To start with, you need to take three steps:
- Go to the Home tab from the Power BI ribbon.
- From the Data group, click Get Data.
- From the Drop-Down list, select the file you need.
(You can press MORE to connect to data from multiple sources.)
In this case, we have a sample data set of food sales in Excel. We want to input these data into Power BI. After completing the first three steps above, follow these steps: - Select the Excel Workbook from the drop-down list.
- Choose your file from your browser.
- Then check or uncheck the table you want.
- Press Load or Transform Data.
The Load and Transform Data Button Difference in Power BI?
While connecting to your data source, The Navigator dialogue box pops up, and you can either press the ‘Load’ or the ‘Transform Data’ button. But which one should be pressed?
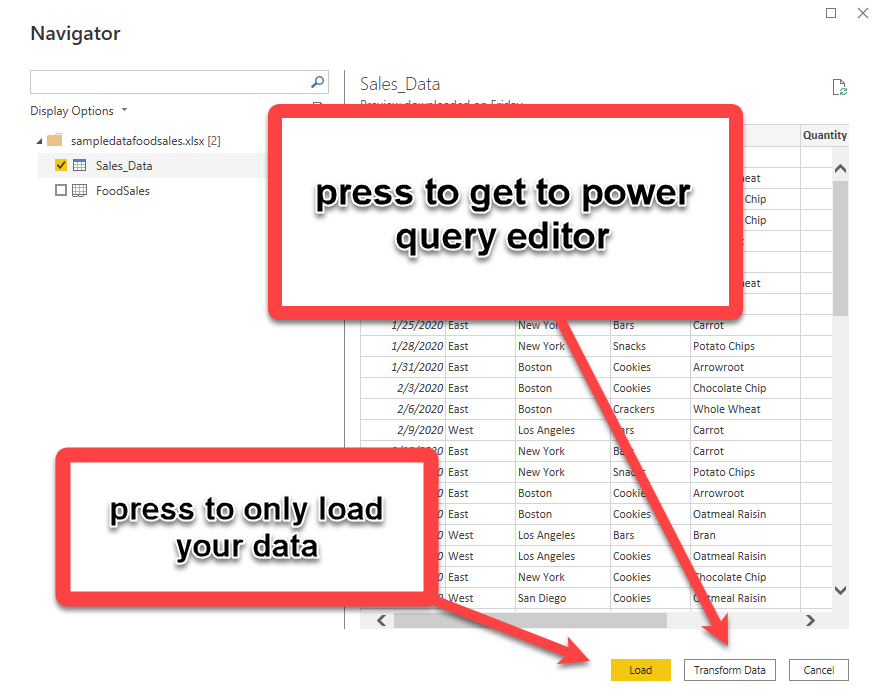
The answer lies in knowing the difference between these two options:
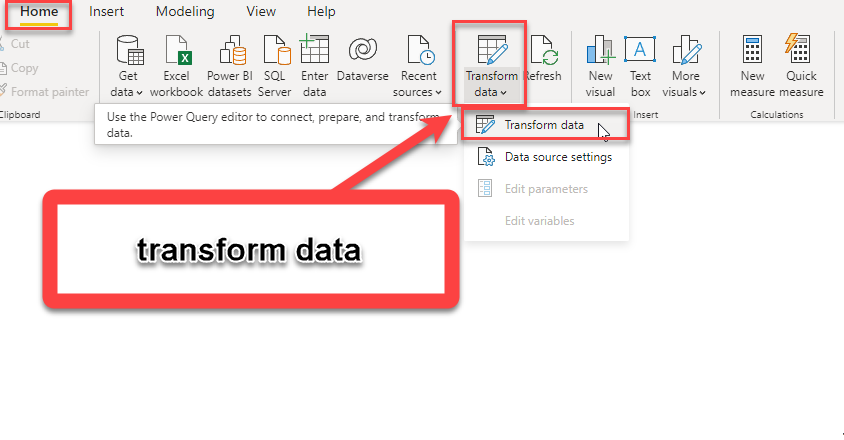
When you press Transform Data, you will enter the Power Query world. But this isn’t the only way to get to the power query editor. After you load your data, you can find the Transform Data button from the Home ribbon.
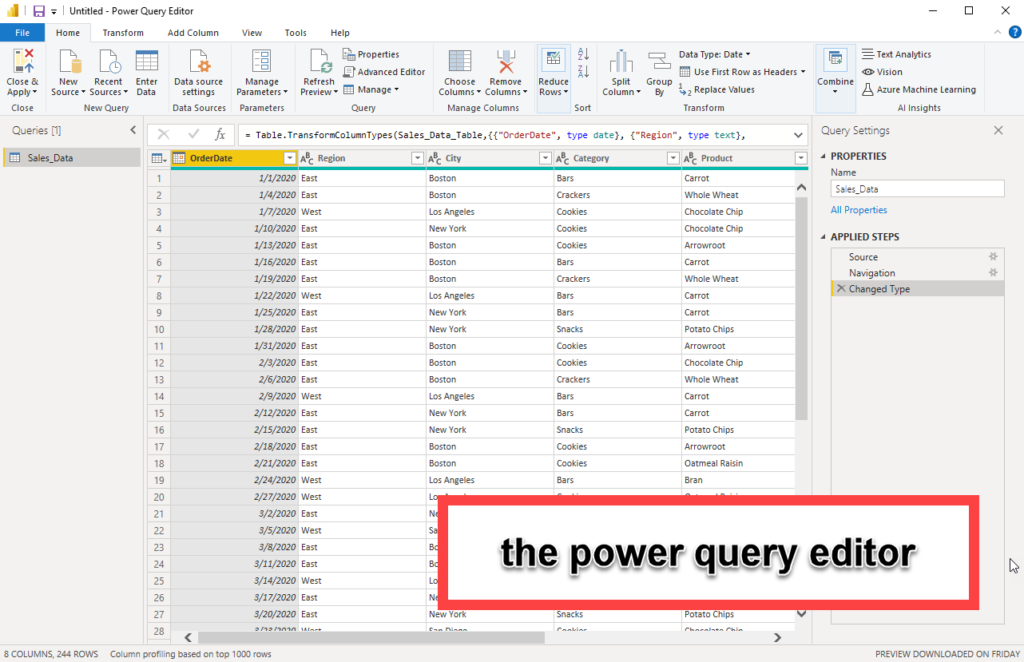
Transform
The power query has many options and transformation functions. Also, you can shape the data to meet your business purposes. Power Query is known for its data transformation and data preparation features. It has many options and functions to shape data to meet your business needs.
Although new Excel users may find Power Query tedious, people who work with Business Intelligence in Excel believe Power Query to be a handy tool, especially the graphic interface of the Power Query editor.
Wrap Up
To conclude, we realized what BI is, explained Power BI, and how it’s downloaded. We covered the differences between Excel and Power BI, how to extract data from sources and use the Power Query tool.
Later on, we are going to discuss how to work with Power Query and transform raw data into the data we need if you found this helpful or have any comments let us know.
Did you know that you can easily reduce costs, accelerate tasks, and improve your data management with Excel Automation Services?
Connect with us, ask our experts, and get support via Excel Support Services.
Our experts will be glad to help you, If this article didn’t answer your questions. ASK NOW
We believe this content can enhance our services. Yet, it’s awaiting comprehensive review. Your suggestions for improvement are invaluable. Kindly report any issue or suggestion using the “Report an issue” button below. We value your input.


